EUR/GBP Technical Analysis
- EUR/GBP confirmed best weekly winning streak in 2018, but upside progress has been slow
- The pair is still consolidating as it awaits its next dominant trend, breakout to upside failed
- Horizontal range resistance outer boundary extended after wick, support remains unchanged
Just started trading EUR/GBP? Check out our beginners’ FX markets guide !
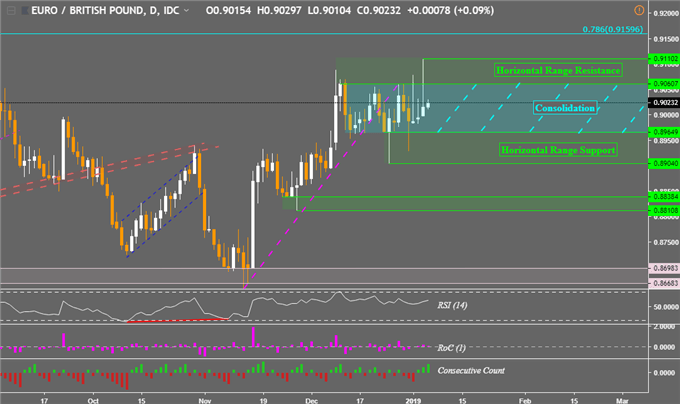
EUR/GBP prices experienced a false breakout under a rising support line from November 2018 which resulted in a transition into consolidation mode as anticipated. The pair remained range-bound between 0.90607 and 0.89649 after an attempt to rise above the horizontal range of resistance failed on the daily chart. This resulted in a relatively large wick that extended the area that is keeping EUR/GBP from resuming its uptrend from late last year.
With that said, EUR/GBP has confirmed its 5th close to the upside on a weekly chart. This is the best winning streak in 2018 and was last seen back in May 2017. However, due to the wicks, upside progress has been relatively slow. The pair is on the verge of its 6th one as we head into this week’s close.
the new range of horizontal resistance is now in-between 0.91102 and 0.90607. This area also contains the August 2018 high around 0.90986. A climb outside of the consolidation range and into resistance would be relatively bullish. Clearing it would then expose the 78.6% Fibonacci retracement at 0.91596 before opening the door to testing the August 2017 highs between 0.93065 and 0.92625.
On the other hand, the horizontal range of support remains unchanged as a boundary between 0.89649 and 0.8904. Falling through it exposes the next area of support in-between 0.88384 and 0.88108 which is constructed with the late November 2018 lows. You may follow me on Twitter @ddubrovskyFX for more immediate updates in EUR/GBP such as when it breaks out of consolidation mode and into its next trend.
EUR/GBP Daily Chart

**Charts created in TradingView
FX Trading Resources
- Join a free Q&A webinar and have your trading questions answered
- Just getting started? See our beginners’ guide for FX traders
- See our free guide to learn what are the long-term forces Euro prices
- See how the British Pound and Euroare viewed by the trading community at the DailyFX Sentiment Page
--- Written by Daniel Dubrovsky, Junior Currency Analyst for DailyFX.com
To contact Daniel, use the comments section below or @ddubrovskyFX on Twitter


