EUR/GBP Technical Analysis
- EUR/GBP on the verge of its longest weekly winning streak in about 16 months
- The pair may be getting ready to either extend its dominant uptrend or reverse
- Clearing horizontal range resistance between 0.906 and 0.9098 won’t be easy
Just started trading EUR/GBP? Check out our beginners’ FX markets guide !
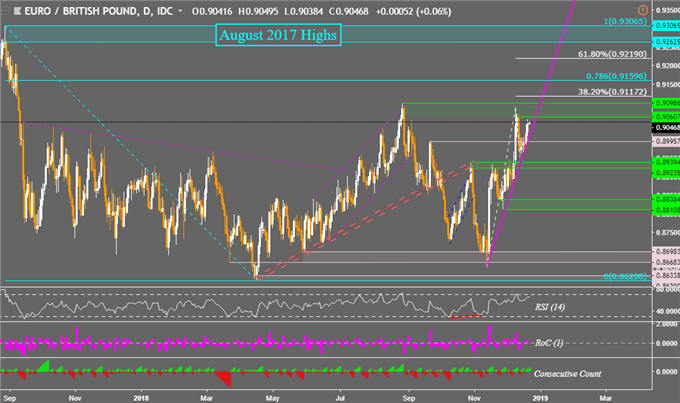
EUR/GBP prices may be on the verge of attempting to breach 2018 highs again after failing to do so when I looked at the pair last week. This area is a range of horizontal support in-between 0.90607 and 0.90986. A push above it, with confirmation, would open the door to testing the August 2017 highs between 0.92625 and 0.93065.
Meanwhile the pair’s dominant uptrend from the middle of November is being supported by a rising trend line. This support line has aided to set the stage for EUR/GBP’s longest consecutive winning streak in about 16 months. If prices end Friday above 0.8979, the pair will have confirmed 4 weeks of gains. A fifth one would be its longest since May 2017.
Looking at the daily chart below, EUR/GBP is running out of congestion space between support and resistance. It perhaps won’t be long until it sets the stage for its next move and whether it will be extending its uptrend or turning lower. Clearing 0.90986 exposes the 38.2% Fibonacci extension at 0.91172 before testing the 78.6% retracement at 0.91596.
On the other hand, a descent through the rising trend line opens the door to testing the September 21st high around 0.89957. Closing under that then leaves near-term support as a horizontal range in-between 0.89235 and 0.89394. You may follow me on Twitter @ddubrovskyFX for more immediate updates in what is going on in EUR/GBP trading.
EUR/GBP Daily Chart

**Charts created in TradingView
FX Trading Resources
- Join a free Q&A webinar and have your trading questions answered
- Just getting started? See our beginners’ guide for FX traders
- See our free guide to learn what are the long-term forces Euro prices
- See how the British Pound and Euroare viewed by the trading community at the DailyFX Sentiment Page
--- Written by Daniel Dubrovsky, Junior Currency Analyst for DailyFX.com
To contact Daniel, use the comments section below or @ddubrovskyFX on Twitter


