


ASX 200 Technical Analysis Talking Points:
- The index remains supported but below its all-time top
- A serious reversal looks unlikely against the global monetary backdrop
- That said solid support may be some way below the current market
Find out what retail foreign exchange traders make of the Australian Dollar’s chances right now at the DailyFX Sentiment Page.
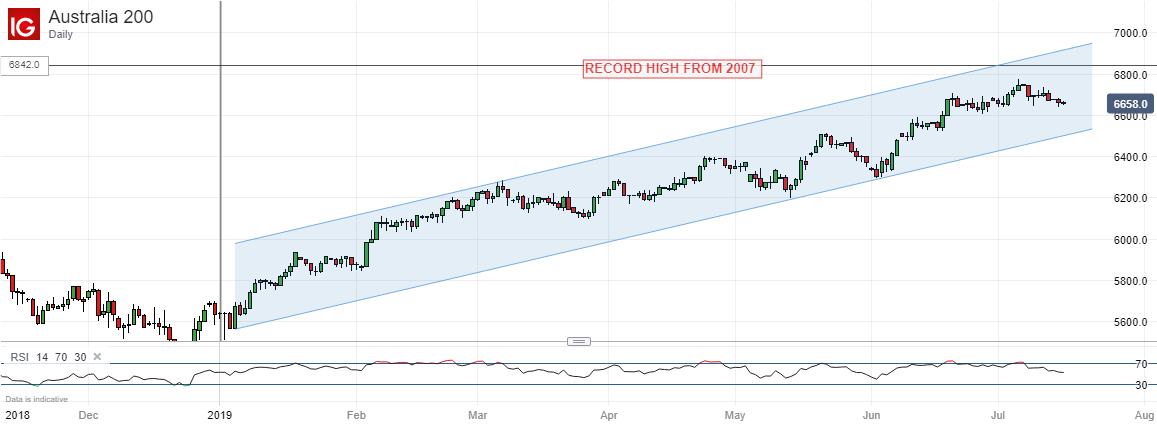
The ASX 200 remains well within its 2019 uptrend channel, with record peaks from 2007 still clearly in sight.
Incidentally the monthly chart uptrend going all the way back to early 2009 also looks very secure.
Fundamentally the index has been underpinned in recent times by the impetus given to stock markets around the world by a US Federal Reserve apparently well prepared to lower interest rates. For its part the Reserve Bank of Australia has already cut its own benchmark lending rates twice in as many months.
The relative weakness of the Australian Dollar has also raised the attractions of local stocks to foreign investors.
Technically it is perhaps notable that that long upward channel has not seen a serious test of its upper boundary since early March, but that fact has clearly not stood in the way of bullish progress.
Still the index has wilted in the last week or so, albeit not to any great extent. Solid near-term support is quite tough to spot at such elevated levels. The first, 23.6% Fibonacci retracement of this year’s rise doesn’t come in until 6489. That’s 170 points or so below the current market and certainly is not under immediate threat even if that gap bears close watching.
The index does appear to have crept back into a range between 6701 and 6608. That previously bounded trade between June 19 and July 3 and a break of that lower limit on a daily or weekly closing basis could be a sign that the bulls are going to have to work harder to push the ASX higher.
There’s probably support below that in the 6500 region, where a notable top was made in early May. However, if the index gets down as far as that then it’s likely that a more obvious reversal is in play with focus likely to come fairly quickly onto that first retracement point.
Still, there are few signs that this year’s rally is in serious trouble yet and indeed it could well be juiced quite soon by those lower US interest rates. In that case the all-time highs will remain a realistic bullish target.
ASX 200 Resources For Traders
Whether you’re new to trading or an old hand DailyFX has plenty of resources to help you. There’s our trading sentiment indicator which shows you live how IG clients are positioned right now. We also hold educational and analytical webinars and offer trading guides, with one specifically aimed at those new to foreign exchange markets. There’s also a Bitcoin guide. Be sure to make the most of them all. They were written by our seasoned trading experts and they’re all free.
--- Written by David Cottle, DailyFX Research
Follow David on Twitter @DavidCottleFX or use the Comments section below to get in touch!


