


ASX 200 Technical Analysis Talking Points:
- The ASX is back to highs not seen since last October
- However, it is looking rather overbought now
- If it can hold on close to current levels, another push higher could be coming
Get live, interactive coverage of all major Australian economic data at the DailyFX Webinars
The ASX 200 has powered up to highs not seen for four months, with its strengthening uptrend leaving its former trading range far behind.
Bullish focus now turns to a resistance zone between 6115 and 6232, figures which bounded trade last time the index got up this high, between September 6 and October 8 last year.
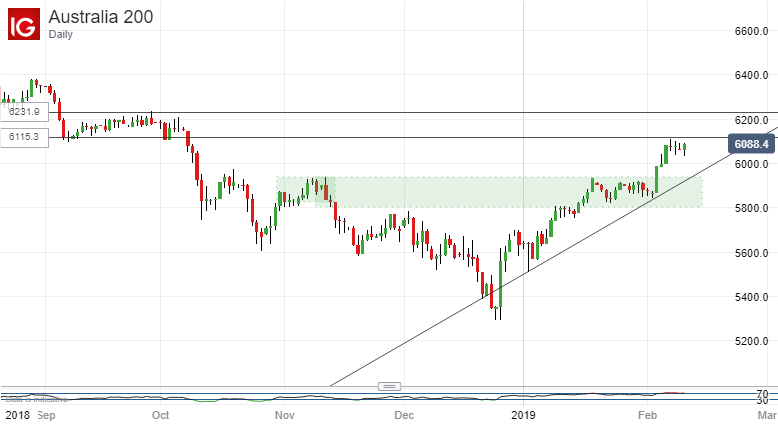
The bulls have put in quite an impressive performance since the lows of late December, and they’ve stepped up the pace in the past two weeks, but they’ve still yet to make a convincing foray back into this resistance area- one confirmed by a succession of daily closes.
They may yet manage to do so, but it is notable that the ASX’s Relative Strength Index is starting to look very over-sold. It currently registers around the 74 handle, clearly above the 70 mark which usually sets the alarms ringing.
In short this looks like an index in need of some consolidation. It will probably remain quite bullish, at least in the short-term, if that consolidation takes place above the old trading range, marked in green on the chart above.
Even a fall back into it need not be disastrous for the bulls’ case. But it may become more serious if the daily-chart uptrend line from January 3 gives way.
Still, that’s not the preferred scenario at present, and it may well be best for the uncommitted to wait and see where that consolidation occurs before stepping into the market now. It may give a useful clue, and investors probably won’t have very long to wait for it.


