


ASX 200 Technical Analysis Talking Points:
- The ASX 200 remains under some pressure
- However that seems to abate, still on approach to the year’s lows
- Keep an eye on that support zone
Get live, interactive coverage of all major Australian economic data at the DailyFX Webinars
The ASX 200 index remains very much in thrall to the pervasive downtrend which began in earnest in early October.
That was the point at which global risk-appetite began to nosedive as trade tensions deepened between China and the US. This took a toll on equity worldwide but, with Australia heavily exposed to both protagonists, the ASX suffered disproportionately.
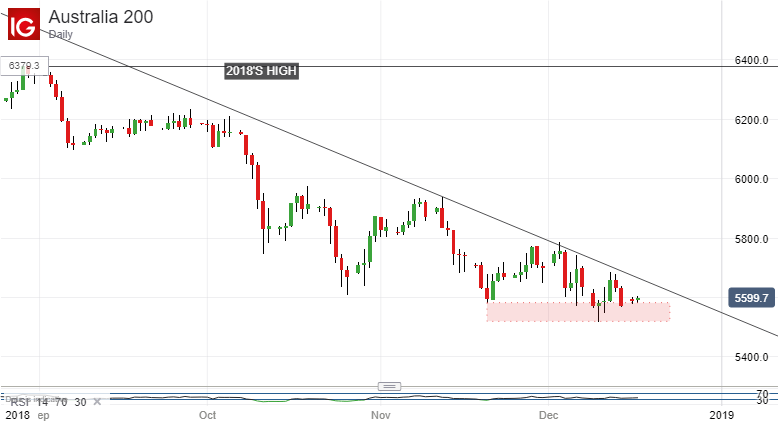
Still, a key short-term support zone identified last week still looks important. It lies between the previous 2018 low of 5586.5 and the new low of 5514.5 hit intraday on December 10. The index still shows no inclination to trade below that region, and seems to quickly trade up out of it if it is tested.
However at current levels bulls of the Sydney stock benchmark is clearly fighting hard to avoid at least another retest of this zone. If the index keeps out of it once again on a daily or weekly closing basis then it is possible that some sort of base is being built in this region.
In that case it may be tempting to play for an approach to, if not a break of, that dominant downtrend line.
At present it comes in about 60 points above the market at 5669.
As long as the support zone pictured in red on the cart above holds, it might make sense to hold on in anticipation of a trendline test.
However, markets will soon start to thin out for the holiday break and moves may be exaggerated as a result. Still, if the index can close out this week above its lows then it could hold on in its current range at least until trade ramps up again in 2019.
Resources for Traders
Whether you’re new to trading or an experienced old hand DailyFX has plenty of resources to help you out . There is our trading sentiment indicator which shows you live how IG clients are positioned right now. We also hold educational and analytical webinars and offer trading guides, with one specifically aimed at those new to foreign exchange markets. There’s also a Bitcoin guide for those who feel they’d like to know more about cryptocurrencies. Be sure to make the most of them all. They were written by our seasoned trading experts and best of all they are all free.
--- Written by David Cottle, DailyFX Research
Follow David on Twitter @DavidCottleFX or use the Comments section below to get in touch!


