


ASX 200 Technical Analysis Talking Points:
- The ASX 200 remains on the defensive
- Barring a turn-around it’s looking at four months of steep falls
- It seems unlikely that bulls can force a meaningful reversal yet
Get live, interactive coverage of all major Australian economic data at the DailyFX Webinars
The ASX 200’s swallow dive from August’s ten-year highs goes on.
Indeed, the index has hit a new low this week, sharing fully in the heightened risk aversion which has rippled around the world. A gloomy fundamental combination headed by weaker economic data out of the US and China, along with worries about whether a durable trade settlement between the two can be reached seems to be doing the damage. There are of course other problems, notably from Europe where the Brexit story only seems to get more torturous, while French civil unrest dogs the Presidency of Emmanuel Macron.
This toxic combination has seen the ASX back down to lows not previously seen since the end of 2016.
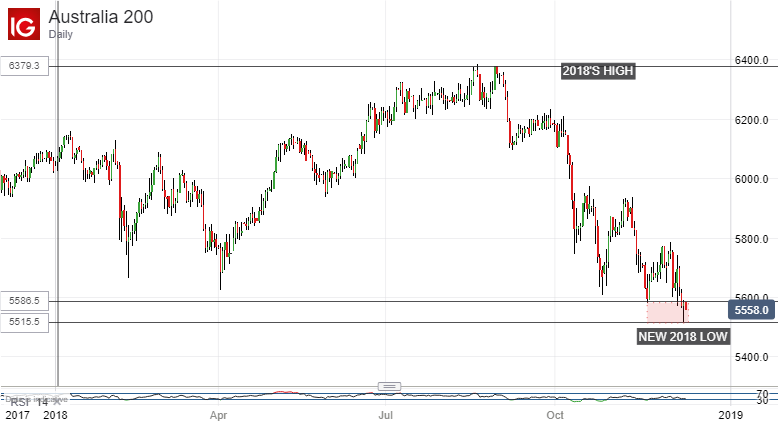
Obviously near-term support from this year is not easy to spot but there does now seem to be a range between the previous 2018 low of 5586.5 and the new low of 5514.5. If the bulls can trade out of this zone on a weekly closing basis then it may be possible that they can get the index back to the peaks of November.

Unsurprisingly the Sydney blue-chip benchmark does look a little oversold by now. With that in mind, any reversals will probably be only modest corrections on the road lower unless they can consolidate above that zone.
It is probably no coincidence that the index’s latest bounce (if such it really proves to be) was seen almost exactly at the fourth, 61.8% Fibonacci retracement of the rise up from 2016’s lows to the highs of this year. It comes in at 5522.5.
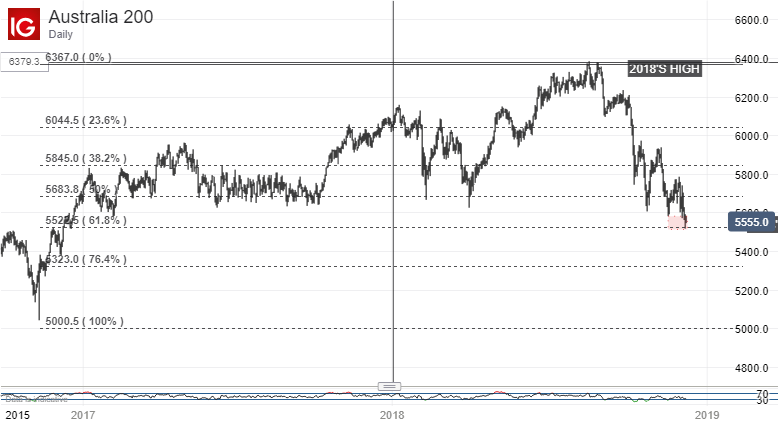
Should current lows break then, the path down to next retracement in the 5320 area will be in focus. Unless the bulls can regain some ground from here in quite short order then another leg lower for this index, perhaps at least as far as the next retracement level, looks like the most probable course.
Resources for Traders
Whether you’re new to trading or an old hand DailyFX has plenty of resources to help you. There’s our trading sentiment indicator which shows you live how IG clients are positioned right now. We also hold educational and analytical webinars and offer trading guides, with one specifically aimed at those new to foreign exchange markets. There’s also a Bitcoin guide. Be sure to make the most of them all. They were written by our seasoned trading experts and they’re all free.
--- Written by David Cottle, DailyFX Research
Follow David on Twitter @DavidCottleFX or use the Comments section below to get in touch!


