


ASX 200 Technical Analysis Talking Points:
- The ASX has broken below its uptrend channel
- A daily close below that could mean further falls
- However, consolidation still looks more likely than a sharp reversal
Find out what the #1 mistake that traders make is and how you can fix it!
The ASX 200 is flirting with the break of a young, steep uptrend channel which has been in place on its daily chart since the middle of this month.
Monday’s sharp selloff came on new worries about global trade, however, and falls were far from unique to the Sydney stock benchmark. However, the day’s slide did take it below that uptrend channel on an intraday basis and the bulls will have to work quite hard to avoid a daily close below it on Tuesday.
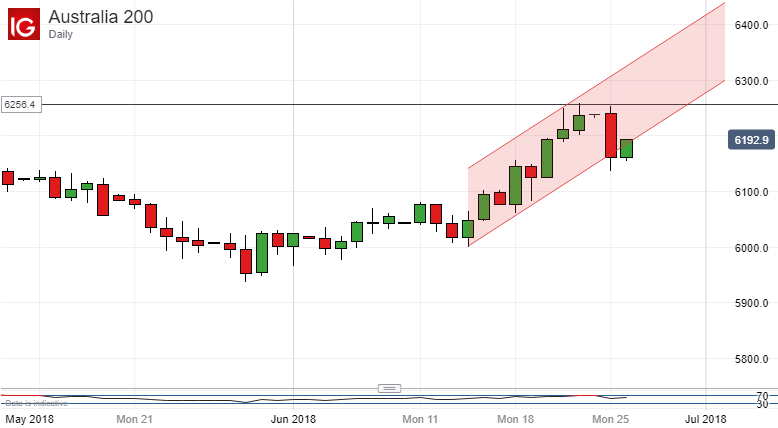
That said some pause for reflection might actually be a good thing for the ASX, which has climbed steeply in the last two weeks to highs not previously seen since 2008. Moreover, despite its slip, the index remains much more firmly within the broader and arguably more dominant uptrend in place since April 4.
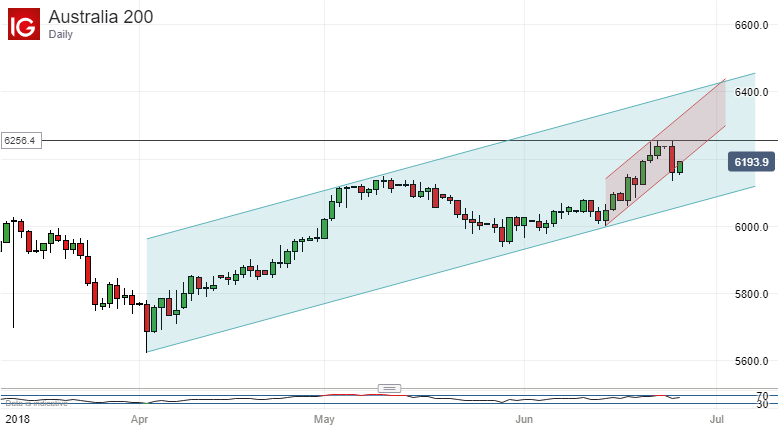
It might now be an idea to keep an eye on the 6116 level. That represents the first, 23.6% Fibonacci retracement of the rise up from those April 4 lows. If that can hold the bears. then it is likely that the index is indeed in consolidative mood rather than anything more sinister.
However, should it slip to the second retracement point at 6023, the situation will become more challenging for the bulls. A daily close around that level would see the broader, blue uptrend channel broken and perhaps put the entire rise into some question.
There are still few obvious signs of major stress. The ASX is above its 20-, 50- and 100-day moving averages, but not by a huge margin in any case. Its Relative Strength Index is nudging up toward overbought territory again, but remains within the generally accepted safe zone below 70.
With that in mind, it’s probably worth playing for that consolidation, revisiting that plan only if the second Fibonacci retracement should give way.
Resources for Traders
Whether you’re new to trading or an old hand DailyFX has plenty of resources to help you. There’s our trading sentiment indicator which shows you live how IG clients are positioned right now. We also hold educational and analytical webinars and offer trading guides, with one specifically aimed at those new to foreign exchange markets. There’s also a Bitcoin guide. Be sure to make the most of them all. They were written by our seasoned trading experts and they’re all free.
--- Written by David Cottle, DailyFX Research
Follow David on Twitter @DavidCottleFX or use the Comments section below to get in touch!


