


ASX 200 TECHNICAL ANALYSIS TALKING POINTS:
- The ASX 200 remains above 6000
- This is not usually a comfortable level for the index
- However its long-term uptrend looks very solid
Find out what the #1 mistake that traders make is so that you never have to join them in it!
The ASX 200 has put on a little bearish spurt in recent days.
Monday’s breah up through the 6114 level took the Sydney stock benchmark above the topmost boundary of a trading channel which, before that date, had contained trade since May 29. That upside channel was itself a continuation of the impressive climb seen since April 2.
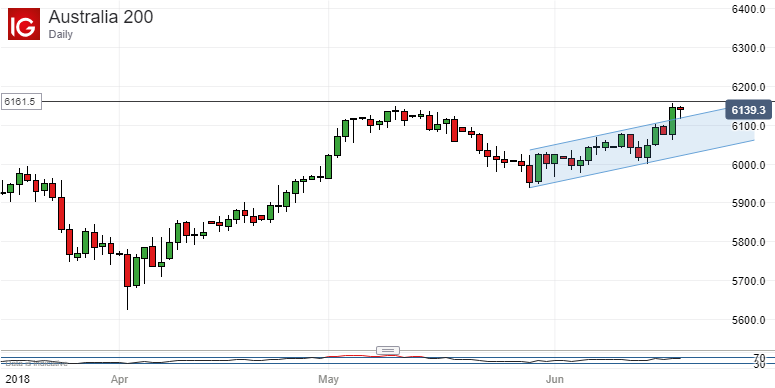
Monday’s intraday high of 6161took the ASX back to its highs for 2018. These were scaled previously back in early January, although the last significant peak took the index close back in early May.
The question now of course is how much further can the index push on? There will be understandable investor reticence this far above the psychologically crucial 6,000 point. After all, the index has spent very little time above that level since 2007. And it only managed a few months above it even then.
Bulls will probably need to consolidate their gains meaningfully in a band between current levels and that previous, May peak of 6150 to convince others that they are here for even the short-term, never mind any more lengthy period.
However, they may have a task on their hands. Reversals will lack obvious support until they hit the first Fibonacci retracement of the rise up from April’s lows. That doesn’t come in until 6032.7 and the problem may be that a fall that far back may be enough to convince the market that yet another probe above 6,000 is failing.
Below that point, second, 38.2% retracement support comes in at 5955.
It’s worth pointing out that the ASX remains very much in the center of the long-term uprend which has been in place since the financial crisis began to peter out in March 2009, as is clearly shown on its monthly chart.. Admittedly the index has failed to test the channel top since 2015 but, all the same, its most recent highs have surpassed the previous peaks made in that year.
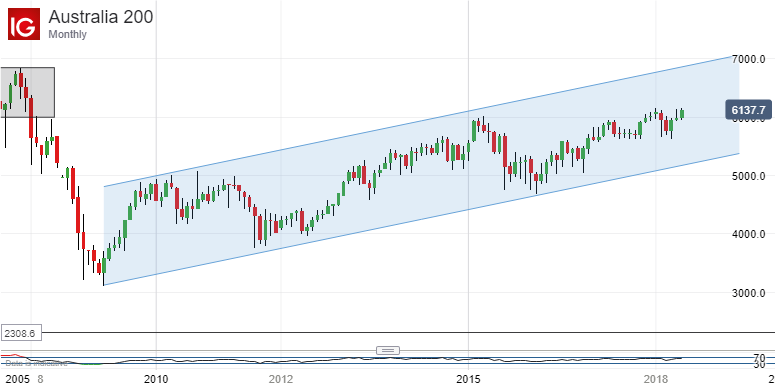
It’s hard to avoid the conclusion that this index has more to give the bulls, as long as the broader market can be made more comfortable with the sight of it above 6,000.
RESOURCES FOR TRADERS
Whether you’re new to trading or an old hand DailyFX has plenty of resources to help you. There’s our trading sentiment indicator which shows you live how IG clients are positioned right now. We also hold educational and analytical webinars and offer trading guides, with one specifically aimed at those new to foreign exchange markets. There’s also a Bitcoin guide. Be sure to make the most of them all. They were written by our seasoned trading experts and they’re all free.
--- Written by David Cottle, DailyFX Research
Follow David on Twitter @DavidCottleFX or use the Comments section below to get in touch!


