


ASX 200 TECHNICAL ANALYSIS, TALKING POINTS:
- The ASX 200 can often look nervous above 6000
- It hasn’t managed to consolidate a foothold above there for many years now
- However this latest foray may not fail, at least not yet
Find out what the #1 mistake that traders make is and how you can avoid it
The ASX 200 shows every sign of having topped out once again close to this year’s peaks.
A bold, rapid upward foray by the bulls took the Sydney stock benchmark up from 5686 in early April to 6151 on May 10.
Now this index is wont to be skittish above the 6000 level. Indeed, it hasn’t ever managed to hold above it for more than a few months at a time, and has barely managed even that for more than ten years. Given that well-known history it’s hardly surprising that 6000 should form such a strong psychological barrier.
Now the index seems to be retreating back towards it again, having topped out for the moment at 6152 a couple of weeks back, since when it has been in steady if shallow decline.
That decline is currently testing the first, 23.6% Fibonacci retracement of the last two months’ climb. It comes in at 6041.3, which is about where the market is at the time of writing. A daily close below this level will put focus on the second retracement which is at 5973.4.
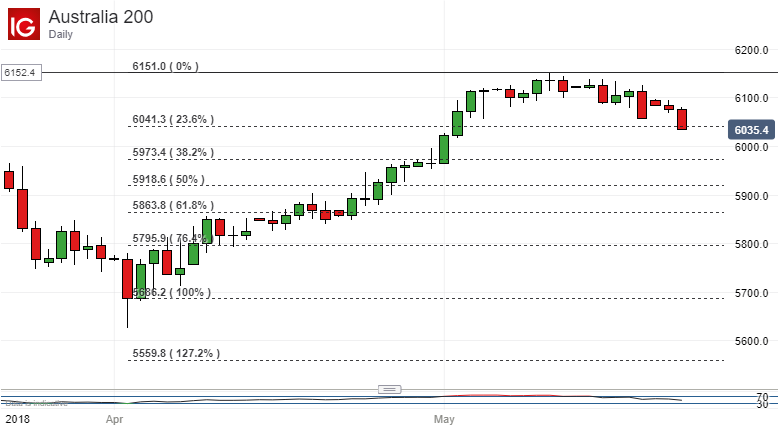
All the same, there are reasons to suppose that a broader collapse is not imminent and that the index can consolidate somewhere near current levels. Its momentum indicators have declined sharply from overbought levels to the point where, right now, they certainly don’t suggest any particular need for further falls.
Moreover the simple 50-day moving average could be about to cross above the 100-day. This would normally be taken as a bullish sign and would, in fact be the second such golden cross to be seen on the daily chart in quite short order.
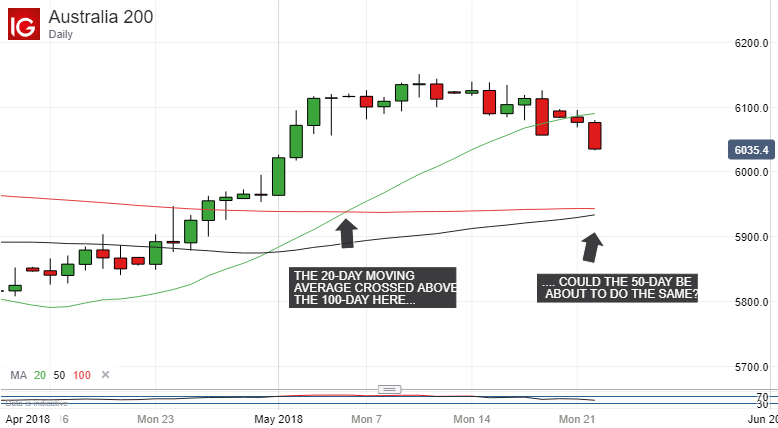
None of these signals is conclusive proof that the index is about to leap higher, but by the same token they do suggest that some caution is warranted even as the 6000 point looms on the downside again. It might be best to play for consolidation around current levels and even another modest push higher for at least as long as that second Fibonacci retracement level holds the bears off.
RESOURCES FOR TRADERS
Whether you’re new to trading or an old hand DailyFX has plenty of resources to help you. There’s our trading sentiment indicator which shows you live how IG clients are positioned right now. We also hold educational and analytical webinars and offer trading guides, with one specifically aimed at those new to foreign exchange markets. There’s also a Bitcoin guide. Be sure to make the most of them all. They were written by our seasoned trading experts and they’re all free.
--- Written by David Cottle, DailyFX Research
Follow David on Twitter @DavidCottleFX or use the Comments section below to get in touch!


