ASX 200 TECHNICAL ANALYSIS TALKING POINTS:
- The Australian stock benchmark is comfortably above 6000
- Investors seem happy to hold it there too
- But caution is neccessary
Join our analysts live for coverage of all major Australian economic data at the DailyFX Webinars. You’ll get plentiful trading tips there too.
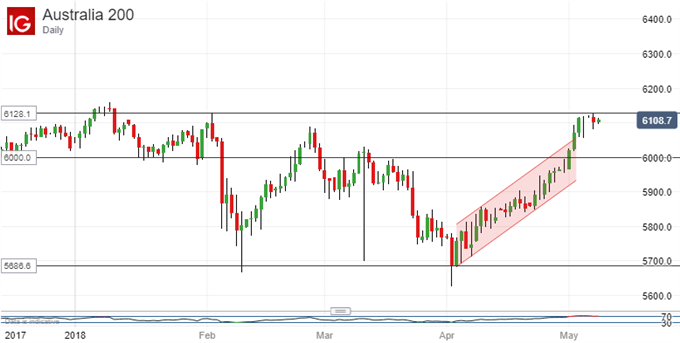
The ASX 200 has broken above its dominant uptrend channel and is sitting above psychologically crucial 6000 level.
For the moment the peaks of 2018 still remain elusive but, at 6158 or so, they’re not very far above current market levels.
But the problems bulls face in this rarified altitude are old ones. This index finds it extremely difficult to get comfortable above 6000, having only spent a few months, cumulatively, above that level in the past ten years.
The risk now is that current levels will merely form a ‘lower low’ below January’s peak with conclusive failure threatening a broader retracement. Rather maddeningly that ASX is currently showing signs of exhaustion on its daily chart, but they are far from conclusive.

Last week’s upward thrust certainly seems short of follow-through momentum, and the Relative Strength Index unsurprisingly suggests that the index is quite severely overbought now.
Still, there’s been no sign of the massive profit taking which can kick in at these levels, and investors seem happy enough to hold the index above 6,000 for the moment.
If you’re currently uncommitted and unconvinced it might be as well to see whether the ASX can hold up here for a few more daily or weekly closes. Those would be signs of genuine consolidation at quite a high level, and may well presage a push higher.
Reversals are likely to find initial support at 6004.2, which is the first, 23.6% Fibonacci retracement of the rise up from April 3’s lows. It is admittedly difficult to see the index holding up so close to 6,000, and the second retracement at 5931.9 may offer a more realistic first reversal target.
To the upside the index would need to get comfortable above the year’s peak – 6158, before pushing on into new territory. A meaningful upward foray looks unlikely to this writer at this point, and disciplined trading above the 6,000 line is essential.
RESOURCES FOR TRADERS
Whether you’re new to trading or an old hand DailyFX has plenty of resources to help you. There’s our trading sentiment indicator which shows you live how IG clients are positioned right now. We also hold educational and analytical webinars and offer trading guides, with one specifically aimed at those new to foreign exchange markets. There’s also a Bitcoin guide. Be sure to make the most of them all. They were written by our seasoned trading experts and they’re all free.
--- Written by David Cottle, DailyFX Research
Follow David on Twitter @DavidCottleFX or use the Comments section below to get in touch!


