


Talking Points:
- The ASX is still in a clear downtrend
- But bulls seem to be making a stand a 5,8000
- A look back to 2017’s charts might tell us why that is
What makes the best stand out? Check out the free DailyFX deep dive into the Traits of Successful Traders
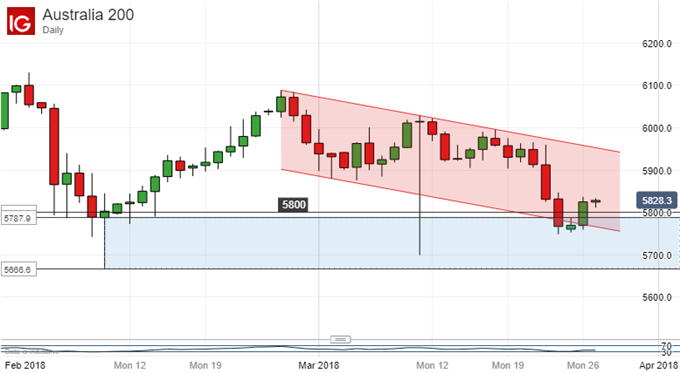
ASX 200 bulls surrendered the psychologically crucial 6,000 level to cruel fortune on March 18. They seem instead to have opted to make their stand around 5,800.
The index slipped down through that level late last week (weighted down fundamentally by trade-war fears and the Wall Street weakness they brought with them). But 5,800 has not been convincingly abandoned. The index bounced just below it this week, retook the level and remains above it, if not by a huge amount.
However, if those bulls are hoping to establish themselves here and consolidate for an upside push, they need to hurry up.
The daily chart’s dominant feature remains the very strong downtrend channel in place since February 28, and itself an acceleration of the previous fall from January’s highs. Its upside is in no obvious danger yet. Moreover, the most recent bounce may have saved 5,800 but, before it happened, the index had to get below its previous key closing low- February 8’s 5787.9. Indeed, the last few days saw a foray down into the space between that low and the intraday nadir of the following day, 5670.7. That’s the lowest point seen since October 4, 2017.
It’s not entirely unreasonable to see some consolidation in this band as likely. Interestingly it corresponds remarkably with the old ‘super range’ which held the ASX completely between May and October 2017.
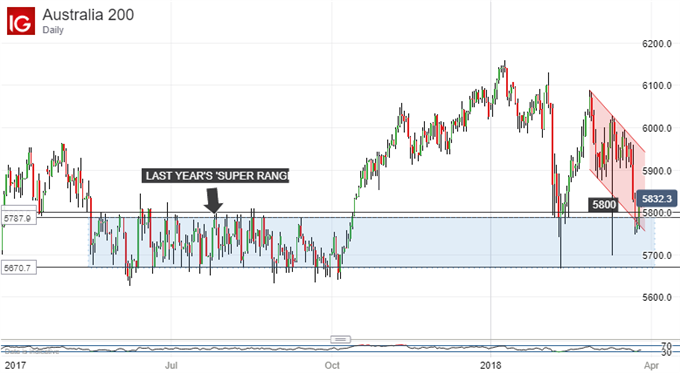
This could well be a region in which the index can expect quite strong support. If the ASX stays above 5,800 then the bulls are clearly making a fight of it. But even if they do this doesn’t look like an index gearing up for another stab at 6,000 so there may not be many points to hope for on the upside.
Of on the other hand it slips back into that blue tinted strip on the chart above then recent evidence would suggest that it could stay there for quite a while.
Resources for Traders
Whether you’re new to trading or an old hand DailyFX has plenty of resources to help you. There’s our trading sentiment indicator which shows you live how IG clients are positioned right now. We also hold educational and analytical webinars and offer trading guides, with one specifically aimed at those new to foreign exchange markets. There’s also a Bitcoin guide. Be sure to make the most of them all. They were written by our seasoned trading experts and they’re all free.
--- Written by David Cottle, DailyFX Research
Follow David on Twitter @DavidCottleFX or use the Comments section below to get in touch!


