


Talking Points:
- The ASX 200 has put in a steady run of gains
- In the process it has managed to close above a notable resistance point
- Could the year’s highs come back into range?
Just getting started in the trading world? Our beginners’ guide is here for you. Do check it out.
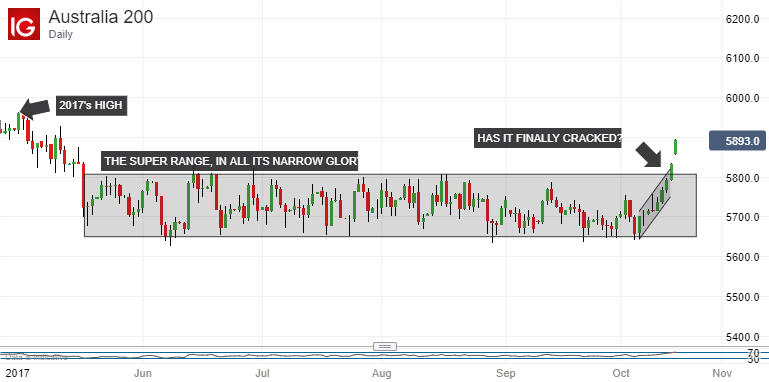
Last week could have been quietly crucial for the ASX 200.
Without fanfare the Australian equity benchmark managed a Friday close above what we I have taken to calling its Super Range. That’s the narrow, 150-point trading band which had contained all the action on a daily close basis since May 17. Hard to believe? You can see it clearly in the chart below.
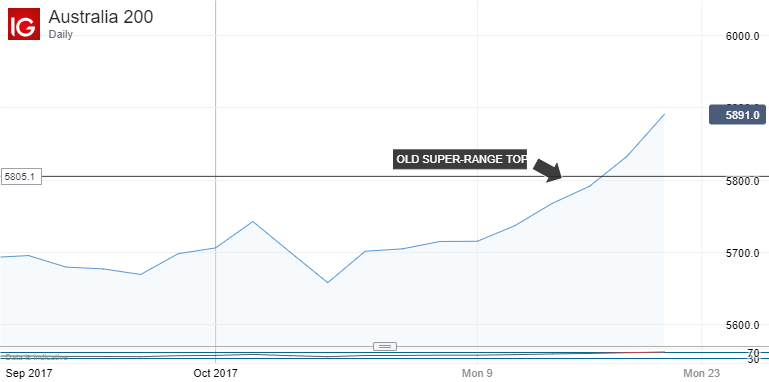
And if we zoom in we can see that the bulls have managed to engineer the first decisive range break we have seen.
Can they make it stick? Well, as you might expect after an impressive run of nine straight higher closes, they are looking a little exhausted, at least for the time being. The ASX’s Relative Strength Index has nudged into the overbought danger zone above the 70 level (it’s now around 74). This suggests that the benchmark could probably do with a period of consolidation and it will be fascinating to see where the lower boundary of this process proves to be.
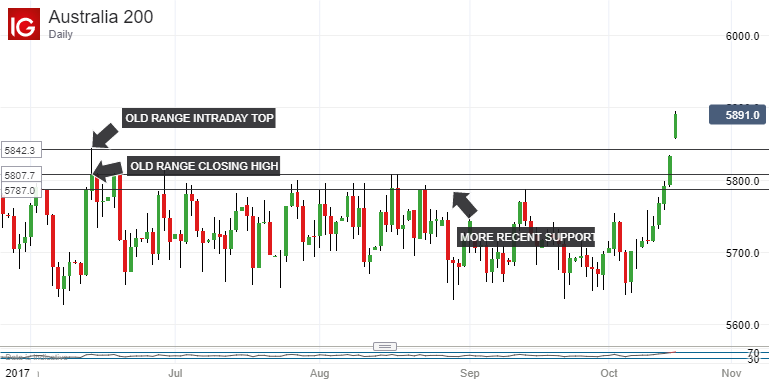
At present the index can probably look to support at the Super Range’s old maximum altitude -June 14’s intraday top of 5842.3. Below that there’s its highest daily close, the same day’s 5807.7. However, while those points are clearly interesting ones for Super Range followers, they are a little distant now, historically speaking. So retracements may instead come back as far as more recent props. That could mean that more recent highs are the ones to conjure with, such as those of mid-August in the 5785 area.
We can’t know yet of course whether the index will have the legs to push on back to its 2017 peak just under 6,000. But an upside Super Range break was a necessary first step- a first step which has now been taken.
--- Written by David Cottle, DailyFX Research
Contact and follow David on Twitter: @DavidCottleFX


