


Talking Points:
- The ASX 200 has lost 2.7% at the open as global stocks buckle
- However the index still remains close to ten-year highs
- And its broad uptrend would seem to have quite a lot of fundamental support
Join our analysts to trade all the major global economic data and interest-rate decisions live and interactive at the DailyFX Weabinars
The ASX 200 is sharing fully in the wave of uncertainty which rocked US equity markets so hard on Monday and which has carried through into an Asia Pacific region which already had its doubts about equity valuations.
The Dow Jones Industrial Average and the S&P 500 both suffered their worst daily loss since 2011 in the previous session.
The ASX 200 has retreated substantially again at Tuesday’s open. Its retreat from last month’s ten-year highs has accelerated and it has plumbed lows not seen since mid-October, 2017.In the process the broad range which has contained trade for over a month.

The last two days have already seen the 23.6%, 38.2% and 50% retracement levels of the entire rise up from the lows of early October. 76.4% retracement hovers a hundred points or so below the market at 5670.9. It is notable that that level and, of course, a complete retracement of the entire rise would take the index below the narrow, 150-point range at which investors were happy to hold the index between May and October of 2017.

In such a febrile fundamental atmosphere the uncommitted may be best served by watching Tuesday’s close for a real gauge as to how much trouble the index may be in from the bullish standpoint.
Some sense of perspective may be gleaned by a look at the ASX 200’s monthly chart. For all the current turmoil the index remains elevated by the standards of the past ten years and it also looks quite comfortable in the long uptrend channel which has endured since the world began to emerge blinking from the worst of the financial crisis in March 2009.
With local, Chinese and US economic numbers all reasonably strong and, crucially, expected to remain so, this doesn’t objectively look much like the precursor of a general equity rout, more the admittedly rapid loss of some froth from a market whose recent gains had taken it up to quickly.
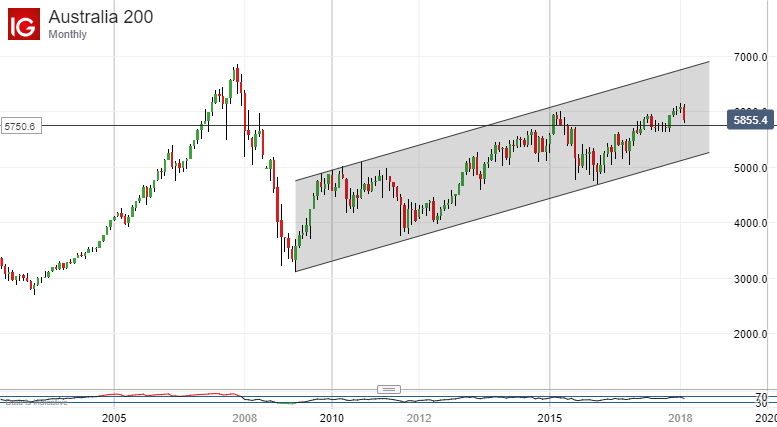
That monthly downtrend channel’s base still lies some 800 points South of current levels and looks safely remote. However even at this longer range it is worth noting that a more recent uptrend channel, from February 2016 is now under a bit more threat.

--- Written by David Cottle, DailyFX Research
Contact and follow David on Twitter: @DavidCottleFX


