


Talking Points:
- The ASX 200 seems to have stalled
- But there’s no sign of panic and many are clearly happy to hold the index at these levels
- Consolidation should bring a fresh try at the year’s peak
Just getting started in the trading world? Our beginners’ guide is here to help
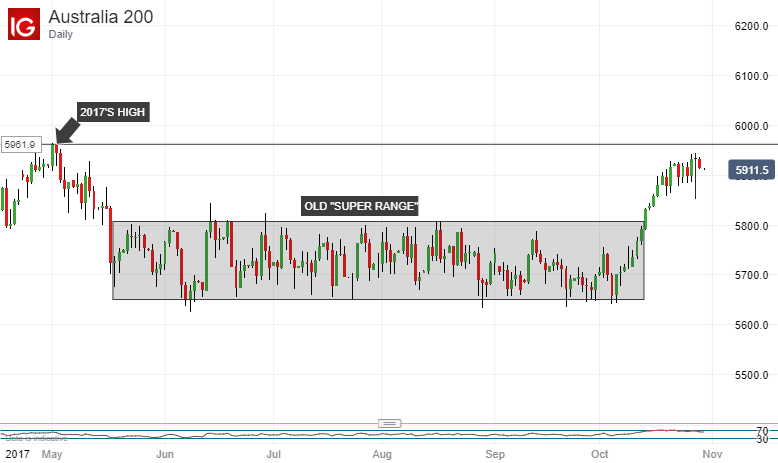
The ASX 200 has broken impressively out of the narrow 150-point range which imprisoned it from early May until the middle of this month.
However, despite leaving that ‘super range’ some way behind, the Australian equity benchmark’s vigour has faded short of 2017’s two-year high. That was the 5961 of May 1, some 220 points above current levels.
Can the index get back up there and, possibly, do even better before the year bows out?
Well, it remains quite comfortably within the uptrend channel formed on October 13 when the old range was broken. However, the downside of that channel is now bounded only by one intraday low, that of October 27. And that day provided investors with an unusually wide range, so it may be a mistake to put too much emphasis on it as support.

An uptrend channel drawn instead from October 11 offers us more valid test points and here we can see a more decisive rejection.
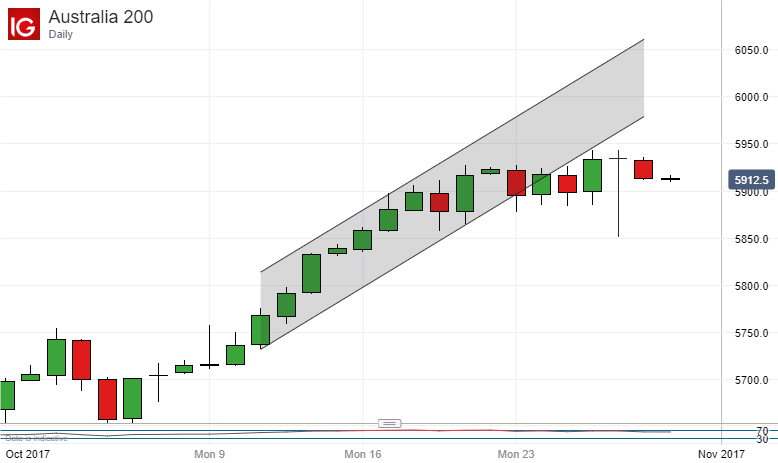
But here again the facts are inconclusive. The index has spent the last five trading sessions below that channel but, even so, it has hardly collapsed. Indeed, daily trade has been remarkably steady at what remains a pretty elevated level by 2017 standards. If many investors yearn to bank their gains at this point, despairing of more, it’s hard to see what they are waiting for.
The case could be made that the ASX is now consolidating around its current levels. This makes some sense as its own Relative Strength Index is retreating from an extremely overbought position to something perhaps a little more sustainable. Note that overbuying has been notable by its absence for much of this year and that extremes such as we have seen in the last two weeks have no parallel since January.
The moving averages still tell a bullish story with both the 20-day and the 50-day having crossed above their 100-day counterpart in the last two weeks.
Care is always warranted if an uptrend shows signs of petering out, of course. But if the ASX managed to hold on in its current range then another push higher could well be in the cards once momentum shifts back toward a more neutral point.
More pronounced falls could find support at 5867.9 and 5824.1. Those levels represent the respective 76.4% and 61.8% Fibonacci retracements of the up move from the lows of October 5.
--- Written by David Cottle, DailyFX Research
Contact and follow David on Twitter: @DavidCottleFX


