


Talking Points:
- The ASX 200 is just where we left it last week
- That means its broad range is still with us too
- However, that range conceals to some extent an enduring downtrend which has yet to break
Get live, interactive coverage of all the economic news which moves the Australian market at the DailyFX webinars
In many respects the ASX 200 is exactly where I left it at my last technical look of exactly a week ago.
The broad range which has been in place since the index retreated from its 2017 high of 5962 on May 1 still endures. On a daily-close basis that range is bounded to the North by June 14 and 19’s 5809 and to the South by June 7’s 5648. There has been a handful of intraday probes outside the range, but they look spurious and can be safely excluded from consideration.

Momentum indicators suggest that the market is not strongly overbought, nor yet oversold, and even the pennant formation we looked at last week is still with us.
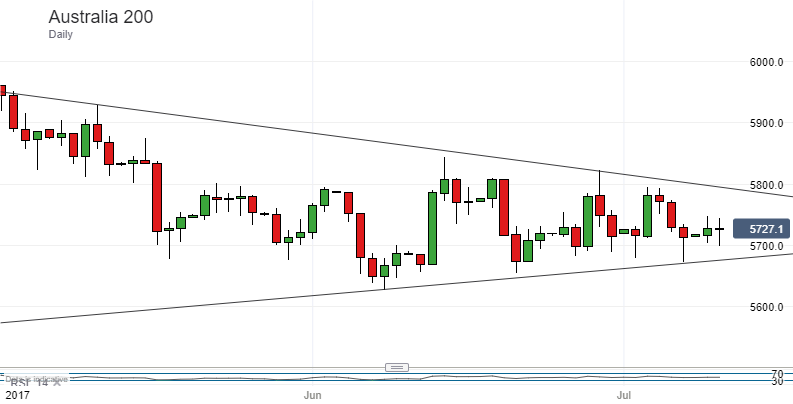
That’s usually a consolidative formation so it’s presence suggests that this is an index yet to make up its mind. As if we needed more proof of that. So, given all of the above, the inescapable truth is that for all its meandering the ASX 200 remains stuck in a downtrend from that May 1 peak.
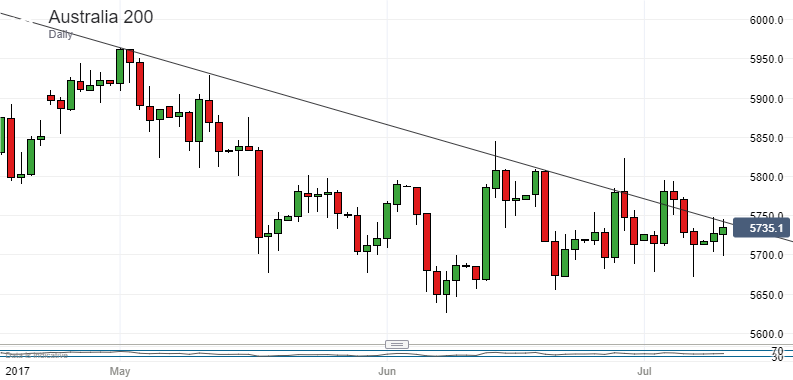
The only question is how embedded that trend is at the moment. Now, if we’re strict about it and draw a trendline taking in all possible intraday points, we get this:

Here the bulls seem to be in trouble with the index well below the line and showing no sign of the guts needed to tackle it. However, apart from the May 1 peak, this trendline really only rests on a single intraday high – that of June 29. That need not make it an especially worthless indicator but, all the same, I think we have some scope to ignore it if we like.
The trendline below would seem to enjoy a bit more justification in terms of closing and intraday points It shows the index in a rather better light – i.e. a lot closer to an upside breakout. However, we mustn’t get too far ahead of ourselves.
A test of the range bottom remains the most likely eventual outcome of current trading action. That is unless the ASX can bring itself to break convincingly above a downtrend which is pervasive no matter which actual trend-line you find most convincing.
--- Written by David Cottle, DailyFX Research
Contact and follow David on Twitter: @DavidCottleFX


