


Talking Points:
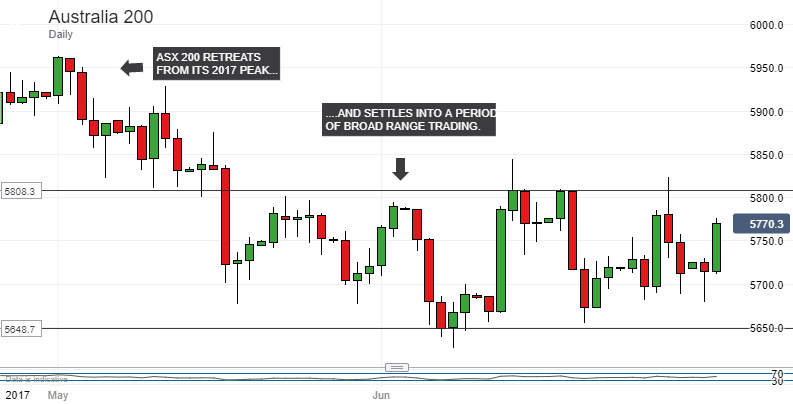
- The ASX 200 has not fallen very far from this year’s highs
- Its trading range since has been broad, but far from bearish
- However a pennant which might be a bear signal has also formed
Get live coverage of all major Australian economic data, including Tuesday’s interest-rate decision, at the DailyFX webinars.
From one perspective, the ASX 200 index has done reasonably well since it made its 2017 peak back on May 1.
While it obviously hasn’t managed to push any higher, there has equally clearly been no great rush to sell either. The ASX has settled into a broad range-trade in the two months since that peak, a range which endures as July’s action gets under way.
So far so ‘meh’. However, if we look at essentially the same chart from a slightly different perspective, we get a slightly different but perhaps much more interesting picture.
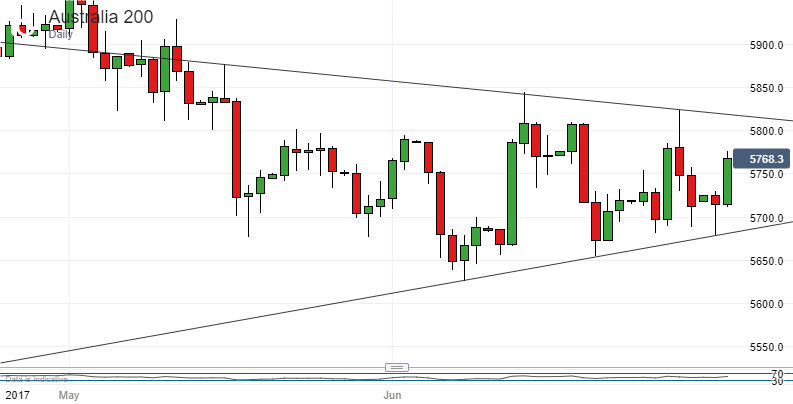
The pattern of intra-day highs and lows forms with some conviction the double narrowing trend-lines known as a pennant, for its obvious nautical-flag-like qualities. However, this may be something of a non-traditional formation.
What we might call the received wisdom of technical analysis suggests that a pennant such as this, formed during a downtrend, is a ‘consolidation pattern.’ That means that the index is consolidating, or resting, and that we will probably see the downtrend resumed when the index crosses below the lower bound of the pattern.
However, the ASX’s downtrend was hardly formed when this pattern started, indeed the most obvious prop of the trend came a mere ten days after that May peak. That’s not to say that the index won’t break this pennant to the downside and resume its slide. But it might be wise to wait and see whether it does so before committing.
--- Written by David Cottle, DailyFX Research
Contact and follow David on Twitter: @DavidCottleFX


