


Talking Points:
- ASX 200 moves above the 5,380 long term range top resistance
- A push above 2016 highs at 5431 and further positive momentum might suggest that the bulls are back in control
- Index may need to see another burst higher and a hold above highs to gain real traction
learn good trading habits with the “Traits of successful traders” series
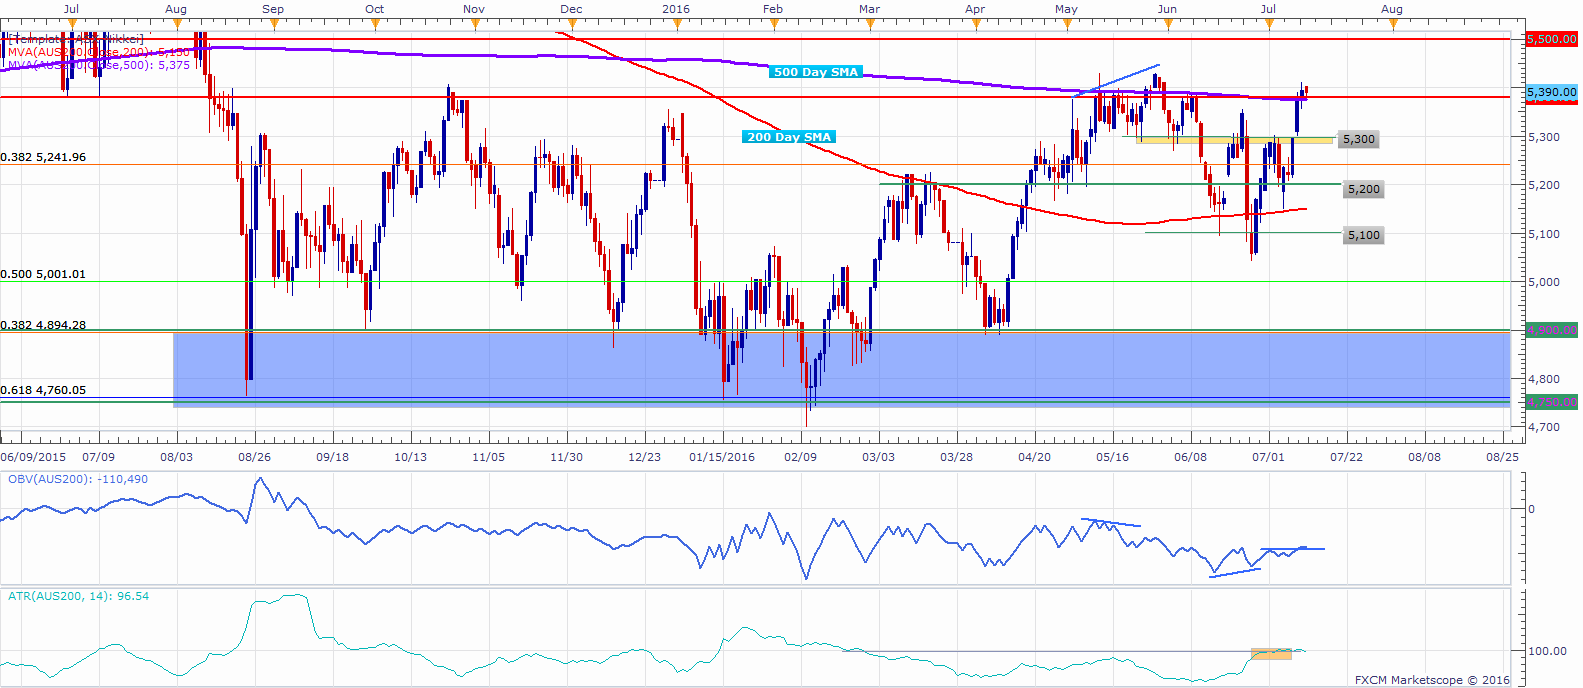
The ASX 200 is trading higher after closing above a long term resistance level at 5,380 which coincided with the 500-day SMA.
The ASX 200 has been trading for the past months in a well-defined range between the 5,380 resistance and the 4,750 support, which coincided with the 0.618 Fib level of the long term up trend leg from 2012.
At this stage, the index might need to see a further push higher above 5,400-5,431 which is the 2016 high. Past attempts to hold above those levels failed this past year as the index remained in range bound conditions.
Price might need to see a clear break and a hold above those levels to indicate that the bulls are really back in control, which could then potentially imply that the long term uptrend may be resuming.
Contrary to other attempts this year, the SPX 500, which is a correlated risk asset, has seen a break higher to all time highs.
Ideally for the bulls might be a scenario in which the index sees another strong push higher to around 5,500 and a pullback with a hold on a resistance turned support basis at 5,380-5,400.
Another failure to hold above those levels might put the focus again on the 5,300 figure, which may act as support. If the index moves below that level, it might need to find a clear break below 5,200 and the 200 SMA before possible further support at the 5,100 figure.
The ASX has seen volatility pick up after the “Brexit” decision and ATR readings remain elevated. This could potentially assist breakout attempts.
ASX 200 Daily Chart: July 13, 2016
--- Written by Oded Shimoni, Junior Currency Analyst for DailyFX.com


