


Australian Dollar Outlook:
- Both AUD/JPY and AUD/USD have traded sideways to lower in recent weeks. Are the sideways consolidations topping patterns or flags?
- The forex economic calendar for the coming week is devoid of significant Australian economic data, putting the onus on American and Chinese data to guide the major AUD-crosses.
- According to the IG Client Sentiment Index, both AUD/JPY and AUD/USD rates have bullish biases in the near-term.
Weathering the Storm
The Australian Dollar has had two diametric forces pulling it in separate directions. On one hand, plunging commodity prices, particularly industrial base metals (copper, iron ore, nickel), has reduced the growth appeal of the Aussie. On the other hand, resilient global risk appetite has seen equity markets push to record highs, suggesting demand for higher yielding, high beta currencies like the Australian Dollar remains robust.
The net-result has been a wash for the Australian Dollar, particularly against the safe haven currencies. AUD/JPY and AUD/USD rates have largely moved sideways to lower in recent weeks. Considering that the consolidations formed following sustained multi-month uptrends, there is still reason to believe that they may ultimately be bullish resolution. However, failure outside of these flags would indicate more significant topping efforts are afoot; only time will tell.

AUD/USD RATE TECHNICAL ANALYSIS: DAILY CHART (March 2020 to June 2021) (CHART 1)
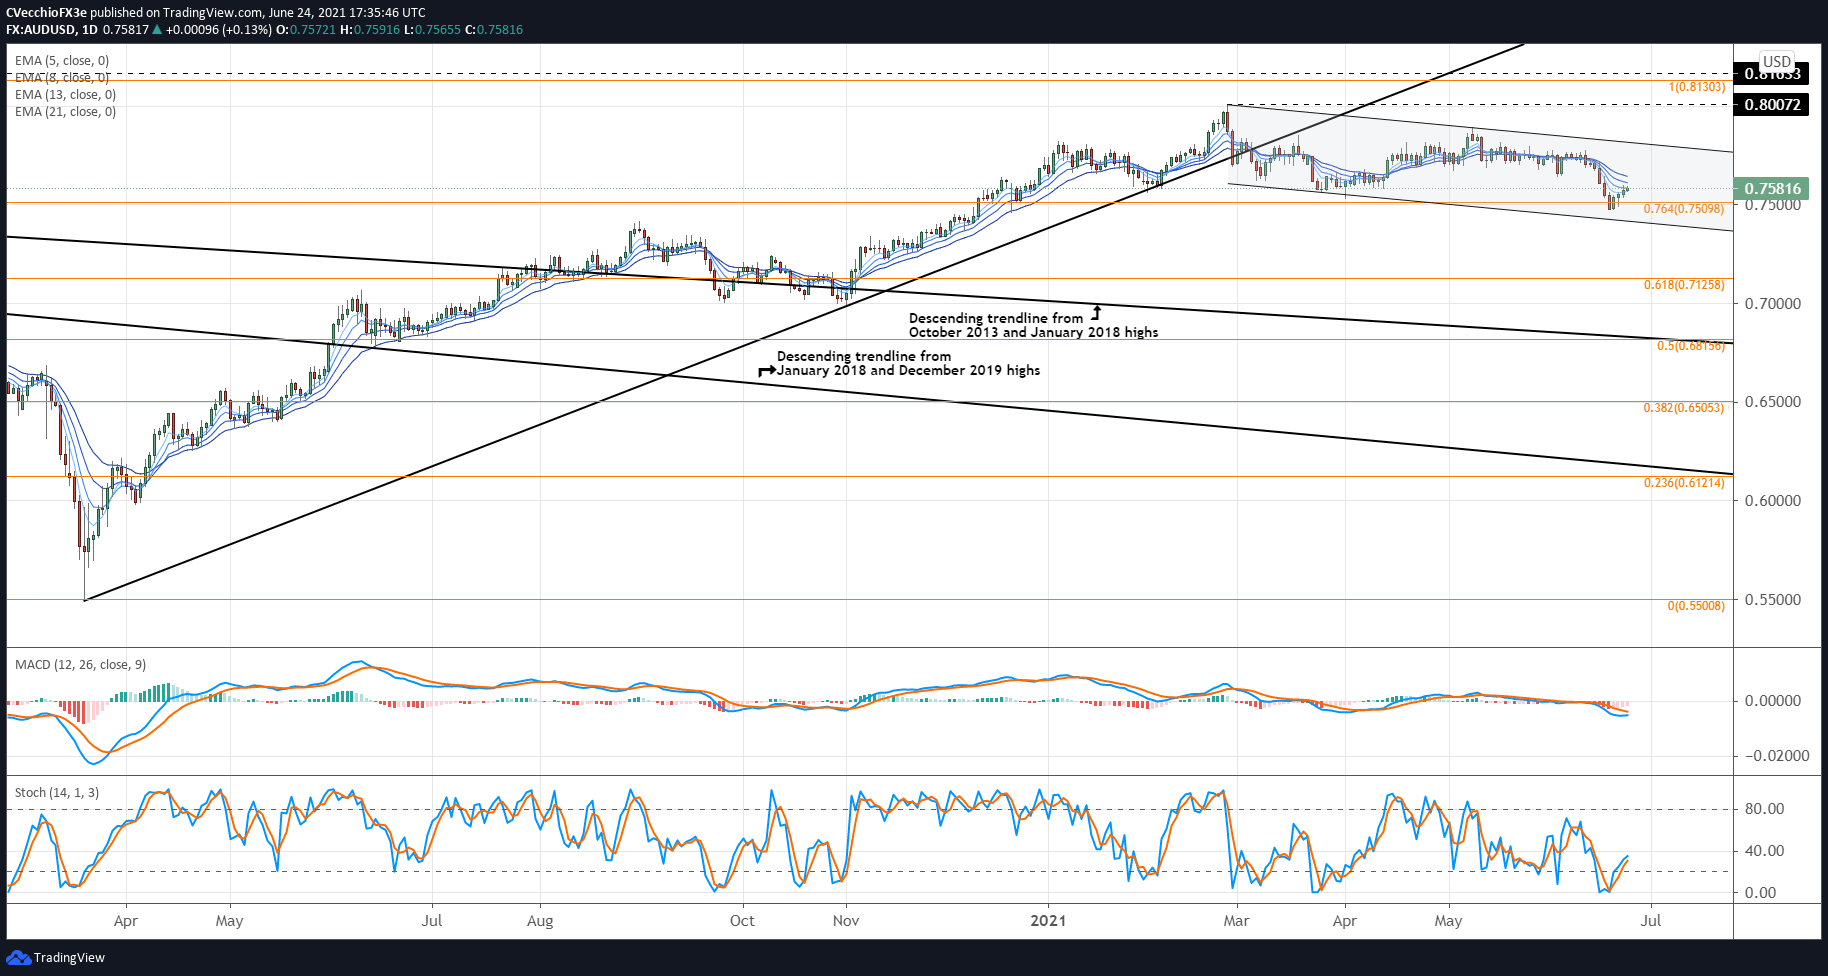
It’s been previously suggested that AUD/USD rates had consolidated into a bull flag, but that “a deeper setback towards the 76.4% Fibonacci retracement of the 2020 high/low range at 0.7510 may begin soon.” to that end, the flagging pattern remains intact. It has taken on a more bearish tone, however, give the series of lower highs and lower lows that have formed since the end of February.
Having just rebounded at the 76.4% Fibonacci retracement of the 2018 high/2020 low move at 0.7510, AUD/USD rates are now running into their daily EMA envelope. A breach above the daily EMA envelope would be a strong indication that a run towards flag resistance (closer towards 0.7700) was developing.
Otherwise, AUD/USD rates’ momentum profile still has bearish inclinations. The pair is below its daily 5-, 8-, 13-, and 21-EMA envelope, which is still in bearish sequential order. Daily MACD is dropping below its signal line, while daily Slow Stochastics have yet to clear their median line.

IG Client Sentiment Index: AUD/USD RATE Forecast (June 24, 2021) (Chart 2)

AUD/USD: Retail trader data shows 57.91% of traders are net-long with the ratio of traders long to short at 1.38 to 1. The number of traders net-long is 0.72% higher than yesterday and 3.27% lower from last week, while the number of traders net-short is 18.11% higher than yesterday and 36.07% higher from last week.
We typically take a contrarian view to crowd sentiment, and the fact traders are net-long suggests AUD/USD prices may continue to fall.
Yet traders are less net-long than yesterday and compared with last week. Recent changes in sentiment warn that the current AUD/USD price trend may soon reverse higher despite the fact traders remain net-long.
AUD/JPY RATE TECHNICAL ANALYSIS: DAILY CHART (March 2020 to June 2021) (CHART 3)
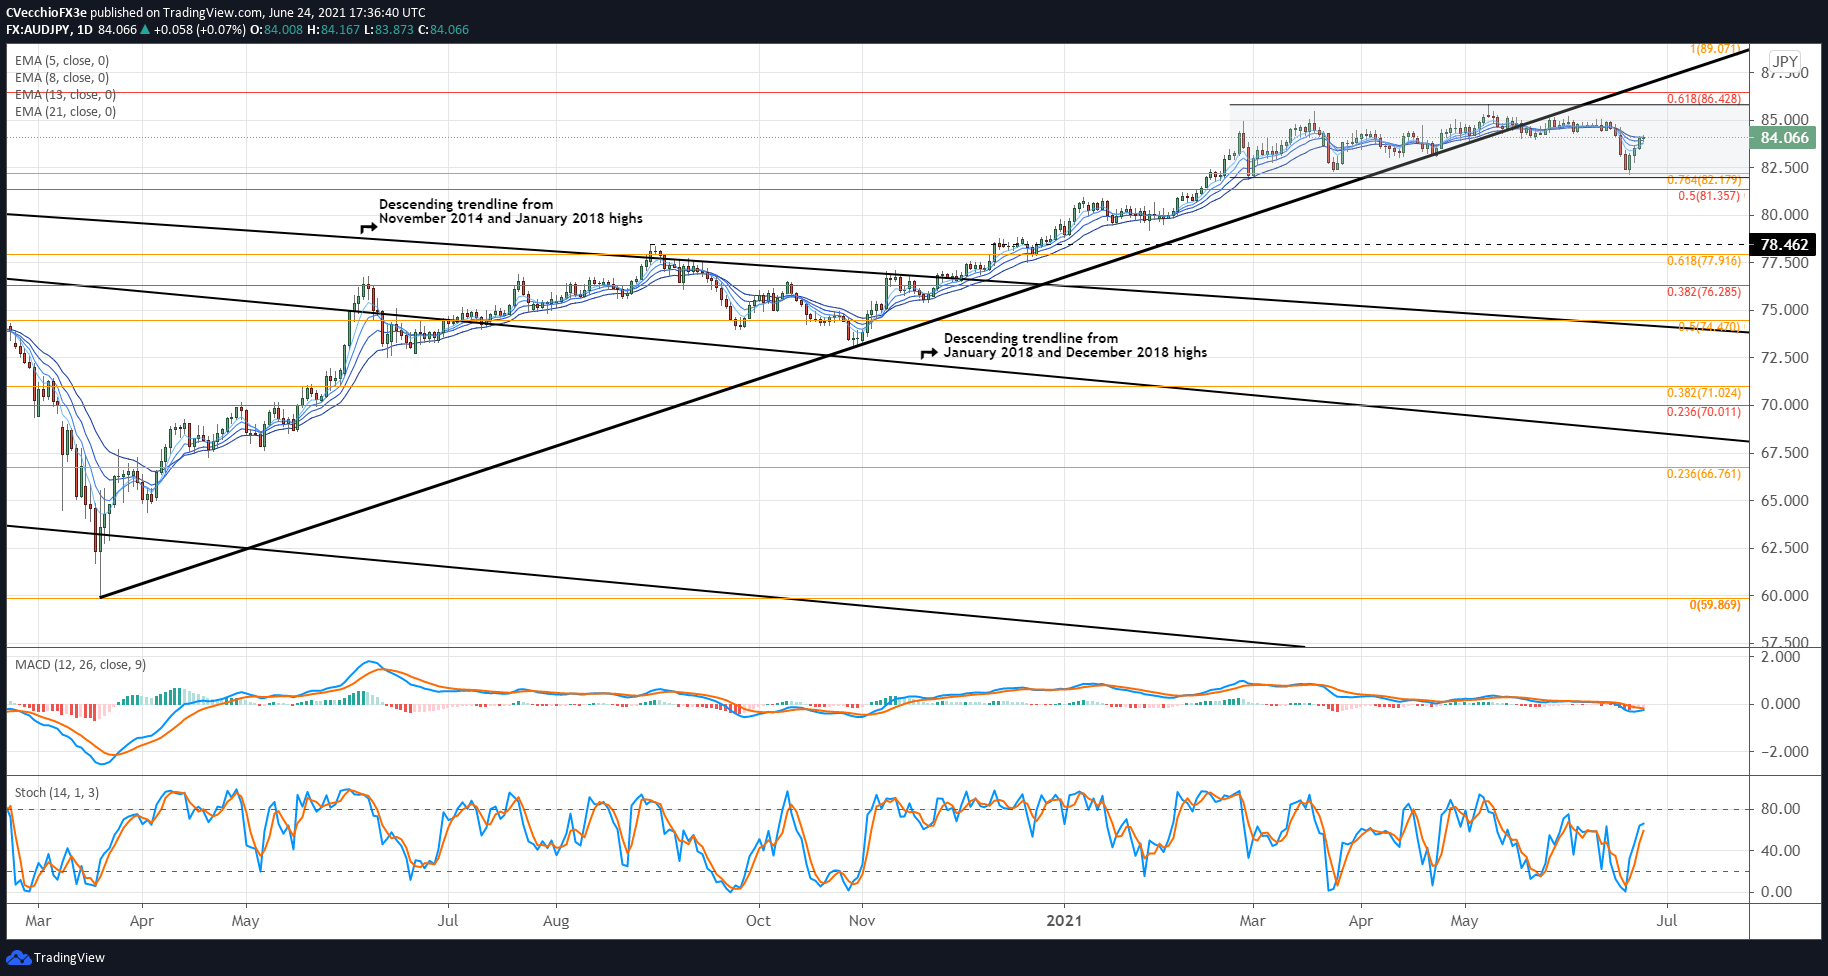
AUD/JPY rates may still be consolidating in a sideways range after losing the uptrend from the March and November 2020 lows. AUD/JPY rates are holding right at their daily EMA envelope following a brief selloff around the June Fed meeting last week. Daily MACD is flat against its signal line, while daily Slow Stochastics are rising but not having yet reached overbought territory. Until AUD/JPY rates clear 81.95 or 85.85, the pair will continue to flag.
IG Client Sentiment Index: AUD/JPY Rate Forecast (June 24, 2021) (Chart 4)

AUD/JPY: Retail trader data shows 32.55% of traders are net-long with the ratio of traders short to long at 2.07 to 1. The number of traders net-long is 1.94% lower than yesterday and 2.56% lower from last week, while the number of traders net-short is 25.50% higher than yesterday and 34.04% higher from last week.
We typically take a contrarian view to crowd sentiment, and the fact traders are net-short suggests AUD/JPY prices may continue to rise.
Traders are further net-short than yesterday and last week, and the combination of current sentiment and recent changes gives us a stronger AUD/JPY-bullish contrarian trading bias.

--- Written by Christopher Vecchio, CFA, Senior Currency Strategist


