Australian Dollar, AUD/USD, AUD/JPY, Technical Analysis, IGCS – Talking Points:
- AUD/USD at risk of a more extensive pullback as price breaches key support.
- AUD/JPY consolidating below pivotal resistance. Is a topside break in the offing?


Although the Australian Dollar’s longer-term outlook remains skewed to the upside, a short-term pullback looks likely against the US Dollar. However, the cyclically-sensitive currency appears poised to continue outperforming the Japanese Yen in the coming weeks. Here are the key levels to watch for AUD/USD and AUD/JPY.
AUD/USD Daily Chart – Support Break Hints at Further Downside
AUD/USD daily chart created using Tradingview
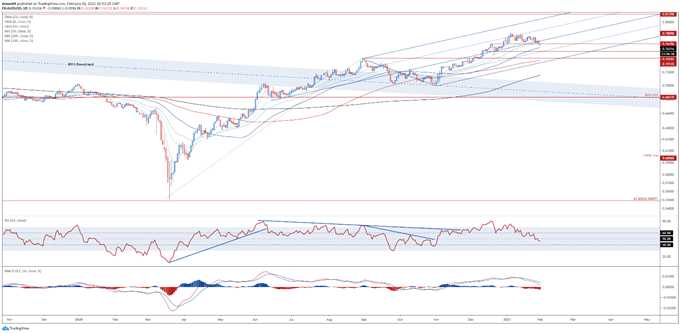
AUD/USD rates could be at risk of a more extended pullback after breaching key confluent support at the 34-day EMA and December 17 high (0.7640).
With the RSI dipping below 50 for the first time since October, and the MACD falling to its lowest levels in 3 months, the path of least resistance in the near term appears lower.
Failing to gain a firm foothold back above the Pitchfork median and 8-EMA (0.7678) would probably allow sellers to drive the exchange rate towards the December 11 low (0.7520). Clearing that likely intensifies selling pressure and carve a path for price to challenge the September high (0.7413).
However, if the trend-defining 50-MA (0.7584) remains intact, a rebound back towards psychological resistance at 0.7700 could be on the cards. Breaching that probably paves the way for a retest of the yearly high (0.7820).
AUD/USD 8-Hour Chart – Symmetrical Triangle Breach to Intensify Selling Pressure
AUD/USD 8-hour chart created using Tradingview
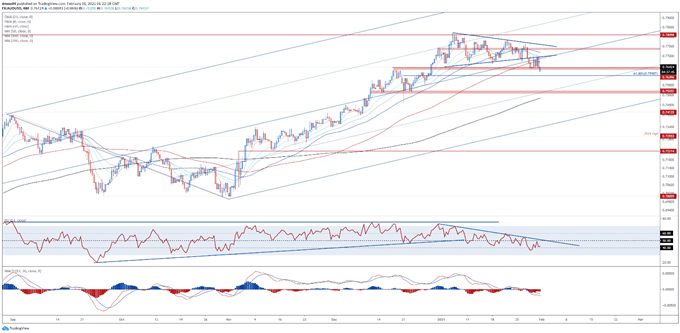
Zooming into the 8-hour timeframe also hints at further downside for AUD/USD, as price breaks Symmetrical Triangle resistance and collapses through the 100-MA (0.7671).
Slicing through the 61.8% Fibonacci (0.7599) likely opens the door to further losses, with the Symmetrical Triangle’s implied measured move suggesting price could fall a further 1.6% from current levels to challenge range support at 0.7510 – 0.7520.
Conversely, if psychological support at 0.7600 holds firm, a rebound back towards the January 29 high (0.7704) may eventuate.
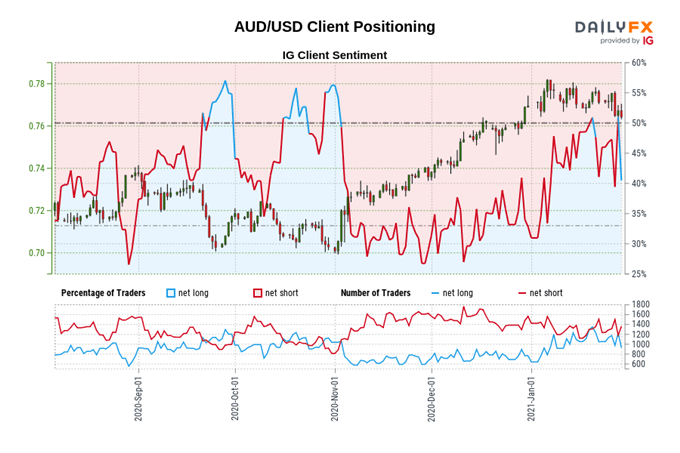
The IG Client Sentiment Report shows 42.06% of traders are net-long with the ratio of traders short to long at 1.38 to 1. The number of traders net-long is 14.89% lower than yesterday and 16.23% lower from last week, while the number of traders net-short is 1.47% higher than yesterday and 5.83% lower from last week.
We typically take a contrarian view to crowd sentiment, and the fact traders are net-short suggests AUD/USD prices may continue to rise.
Traders are further net-short than yesterday and last week, and the combination of current sentiment and recent changes gives us a stronger AUD/USD-bullish contrarian trading bias.
AUD/JPY Daily Chart – Consolidating Above Inverse Head and Shoulders Neckline
AUD/JPY daily chart created using Tradingview
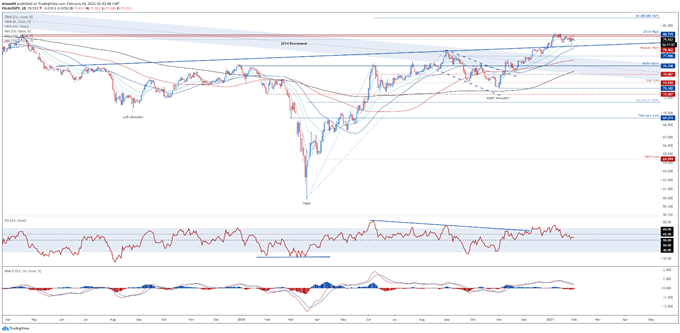
AUD/JPY rates are continuing to consolidate below range resistance at 80.35 – 80.70, after bursting above the neckline of an 18-month inverse Head and Shoulders pattern.
With price remaining constructively positioned above the 34-EMA (79.38), and the RSI and MACD indicator tracking firmly above their respective neutral midpoints, the path of least resistance seems higher.
However, failing to gain a firm foothold back above 80.00 could inspire a short-term pullback towards former resistance-turned-support at the Head and Shoulders neckline and trend-defining 50-DMA (78.74).
That being said, an impulsive push back above 80.00 would probably generate a push to challenge the 2019 high (80.72), with a daily close above needed to signal the resumption of the primary uptrend and bring the 61.8% Fibonacci (83.17) into play.
AUD/JPY 8-Hour Chart – Bull Flag in Play?
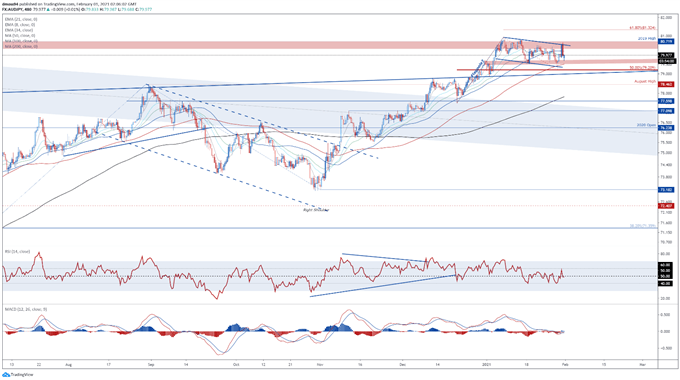
AUD/JPY 8-hour chart created using Tradingview
Scrolling into the 8-hour chart suggests that an impulsive topside push is in the offing, as price carves out a Bull Flag continuation pattern just below the yearly high (80.93).
Piercing flag resistance and the January 29 high (80.65) would probably intensify buying pressure in the near term and bring the 61.8% Fibonacci (81.32) into the crosshairs.
The bullish continuation pattern’s implied measured move suggesting the exchange rate could climb 5.5% from current levels to probe psychological resistance at 84.00.
However, breaching the 100-MA (79.51) could inspire a more extended correction and pave the way for price to test the 50% Fibonacci (79.21).
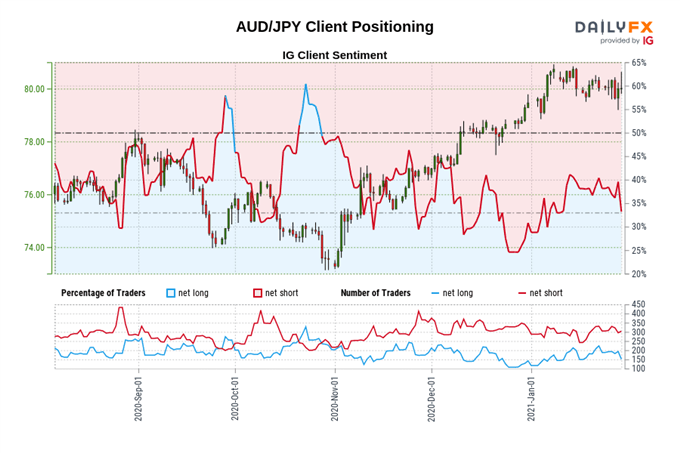
The IG Client Sentiment Report shows 29.90% of traders are net-long with the ratio of traders short to long at 2.34 to 1. The number of traders net-long is 25.16% lower than yesterday and 38.34% lower from last week, while the number of traders net-short is 1.76% lower than yesterday and 11.15% lower from last week.
We typically take a contrarian view to crowd sentiment, and the fact traders are net-short suggests AUD/JPY prices may continue to rise.
Traders are further net-short than yesterday and last week, and the combination of current sentiment and recent changes gives us a stronger AUD/JPY-bullish contrarian trading bias.
-- Written by Daniel Moss, Analyst for DailyFX
Follow me on Twitter @DanielGMoss


