


Australian Dollar, Time Cycle Analysis, AUD/USD, Technical Analysis, IGCS – Talking Points:
- Time-cycle analysis suggests the Australian Dollar may continue outperforming the haven-associated US Dollar over the next 12 months.
- However, the daily timeframe hints that a short-term pullback could be in the offing.
The Australian Dollar’s 37% surge from the March doldrums may prove to be the start of a prolonged period of strength against the US Dollar, as time-cycle analysis suggests 2021 could be a breakout year for the trade-sensitive currency.
AUD/USD Monthly Chart – Cyclical Upturn Afoot

AUD/USD monthly chart created using Tradingview
As mentioned in previous reports, the chart above highlights the cyclical nature seen in AUD/USD rates over the past 24 years, with the currency pair largely adhering to what appears to be an 8-year rotation. It has set significant bottoms in early 2001, late 2008 and 2016.
Recent price action looks strikingly similar to that seen early in the bull cycle ignited in September 2001 and could be indicative of further upside for AUD/USD, given price has cleared psychological resistance at the 0.7500 mark.
Moreover, with the RSI slicing through the downtrend extending from the 2004 extremes, and climbing to its highest levels since early 2012, a cyclical upturn seems to be afoot.
To that end, the trade-sensitive currency seems poised to substantially extend its recent 37% rise against its haven-associated counterpart, with cycle analysis suggesting AUD/USD could probe key resistance at the 100% Fibonacci (0.8909) in the next 12 months.
AUD/USD Weekly Chart – Golden Cross Hints at Further Upside
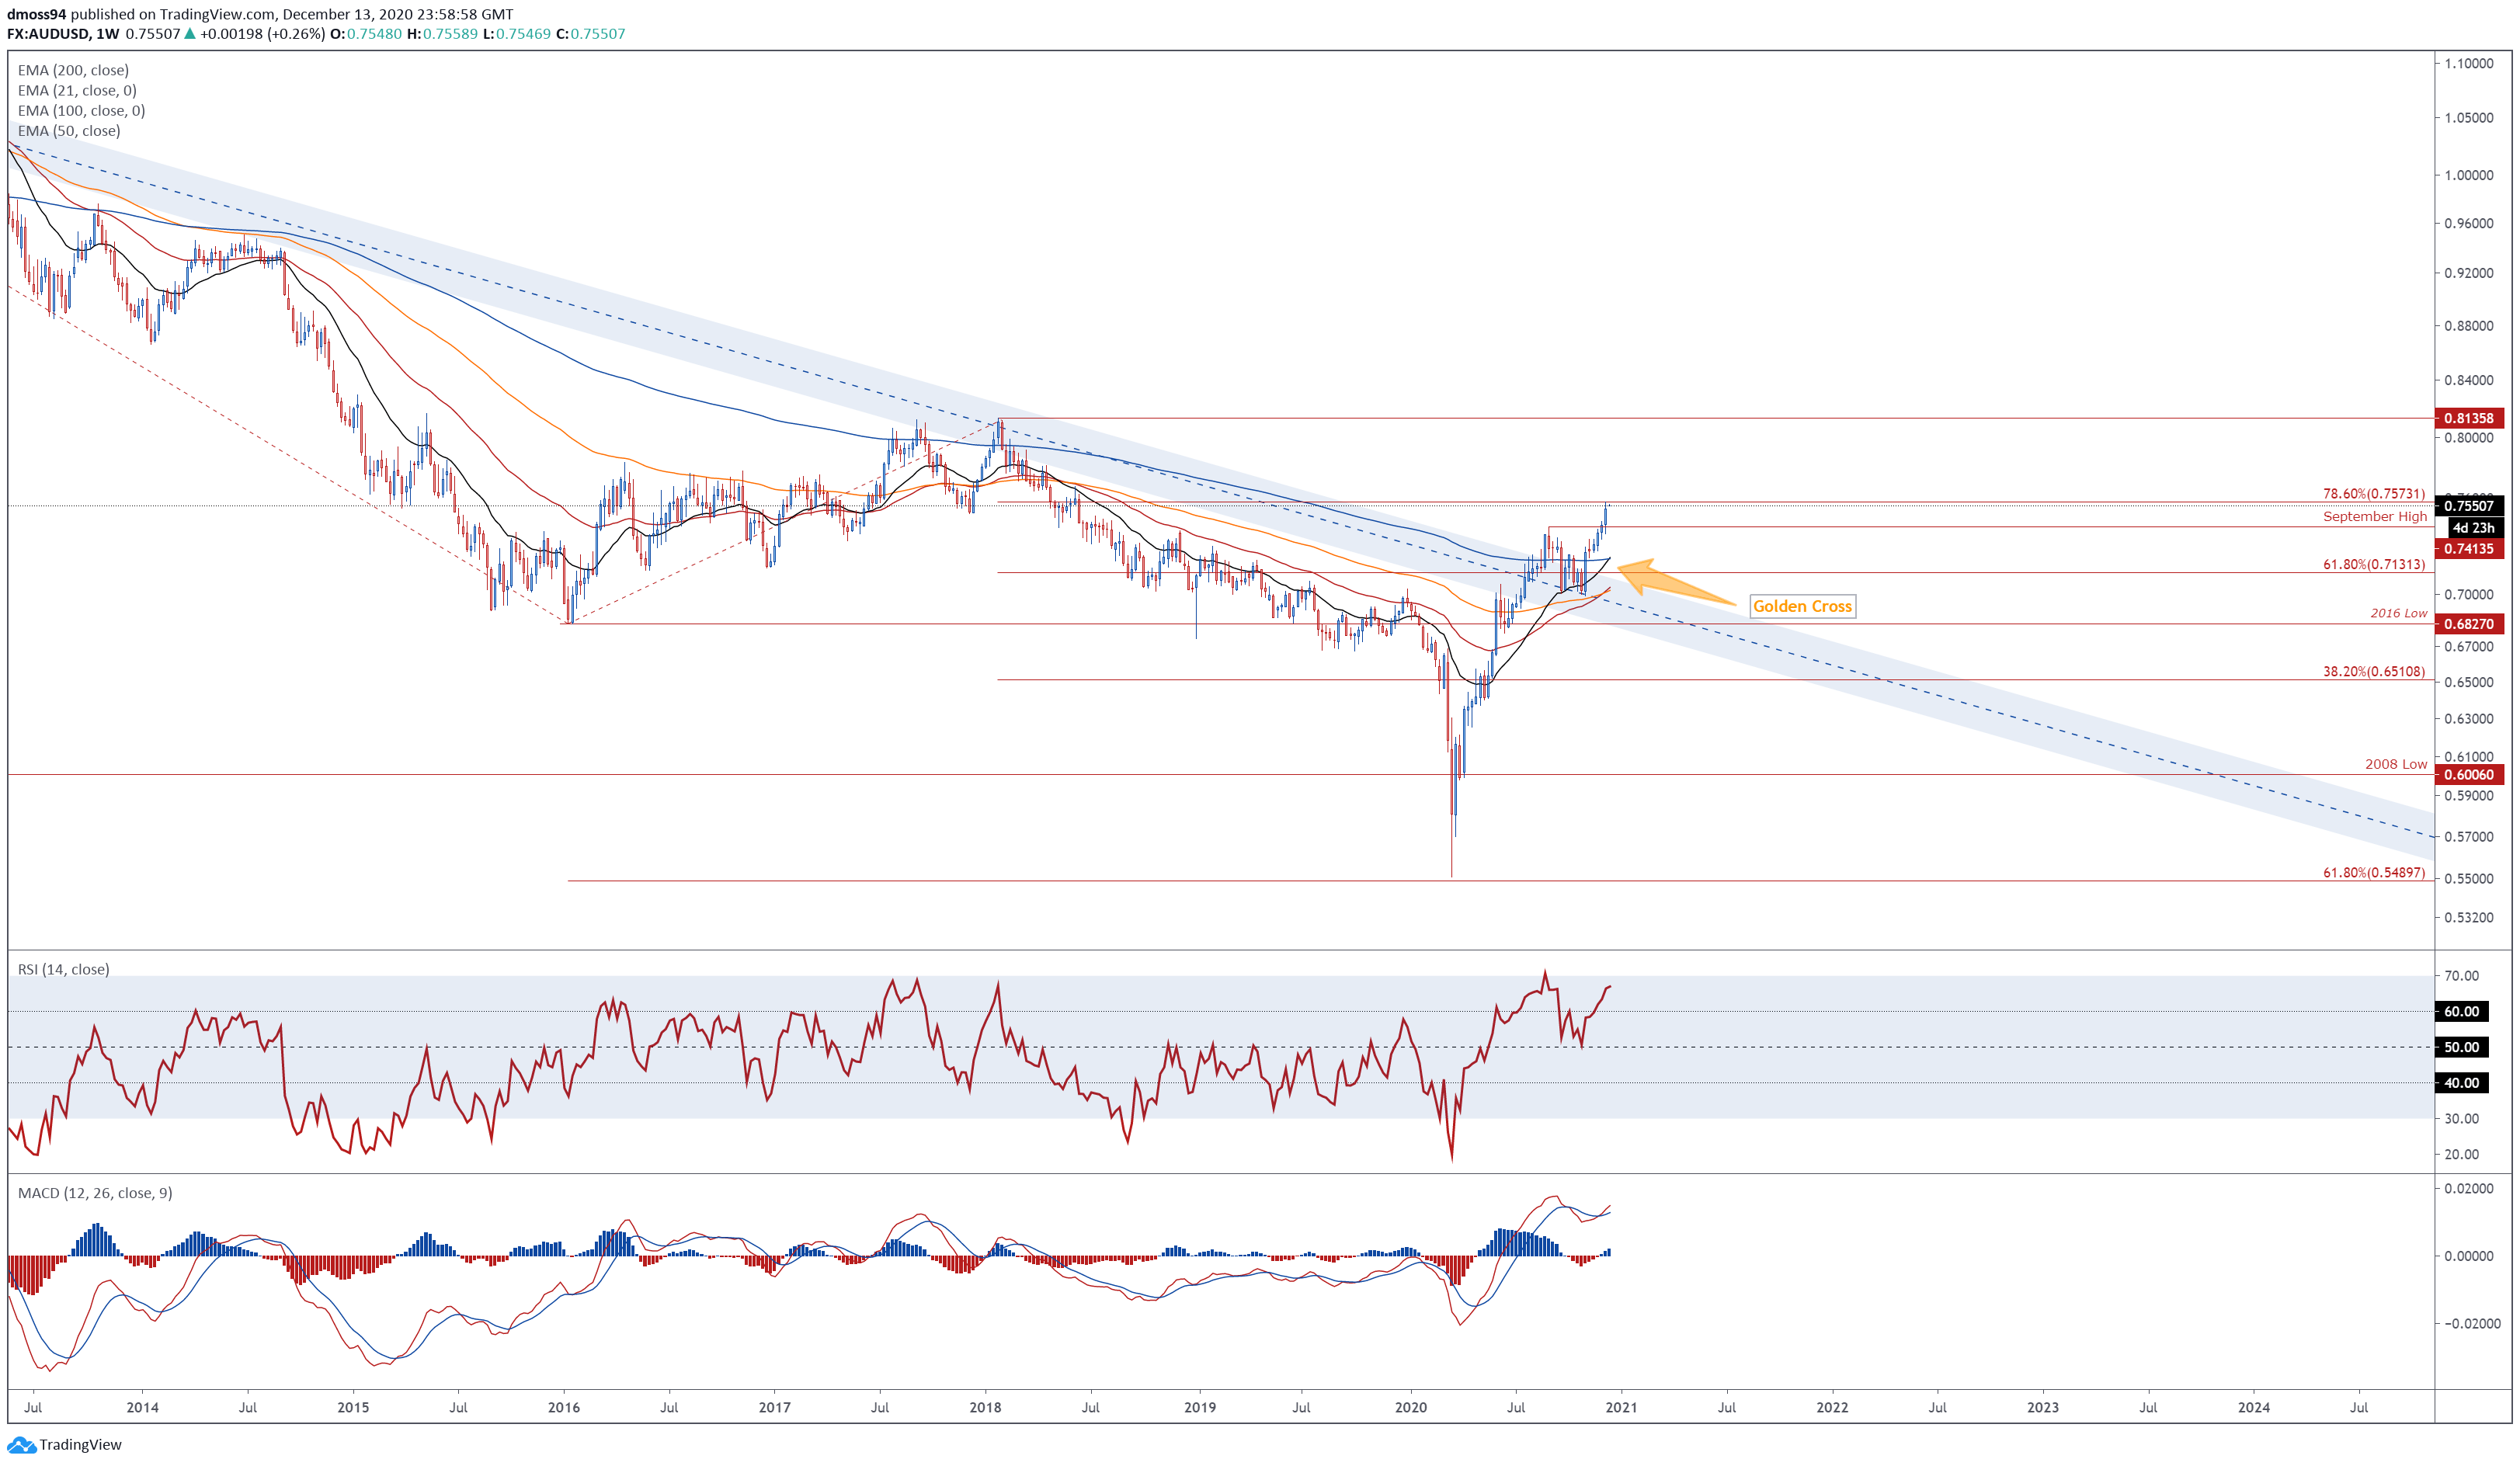
AUD/USD weekly chart created using Tradingview
Jumping into a weekly chart bolsters the bullish outlook depicted on the monthly timeframe, as prices slash through the September high (0.7413) to challenge resistance at the 78.6% Fibonacci (0.7573).
With multiple ‘golden cross’ formations taking place on the moving averages, and the RSI eyeing a push into overbought territory, the path of least resistance continues to favour the upside.
Gaining a firm foothold above the 78.6% Fibonacci on a weekly close basis would probably propel prices towards the psychologically imposing 0.8000 mark, with a break above bringing the 2018 high (0.8135) into focus.
Alternatively, sliding back below the September high could neutralize near-term buying pressure and generate a pullback towards the sentiment-defining 200-week moving average (0.7218).
AUD/USD Daily Chart – Eyeing Psychological Resistance at 0.7600
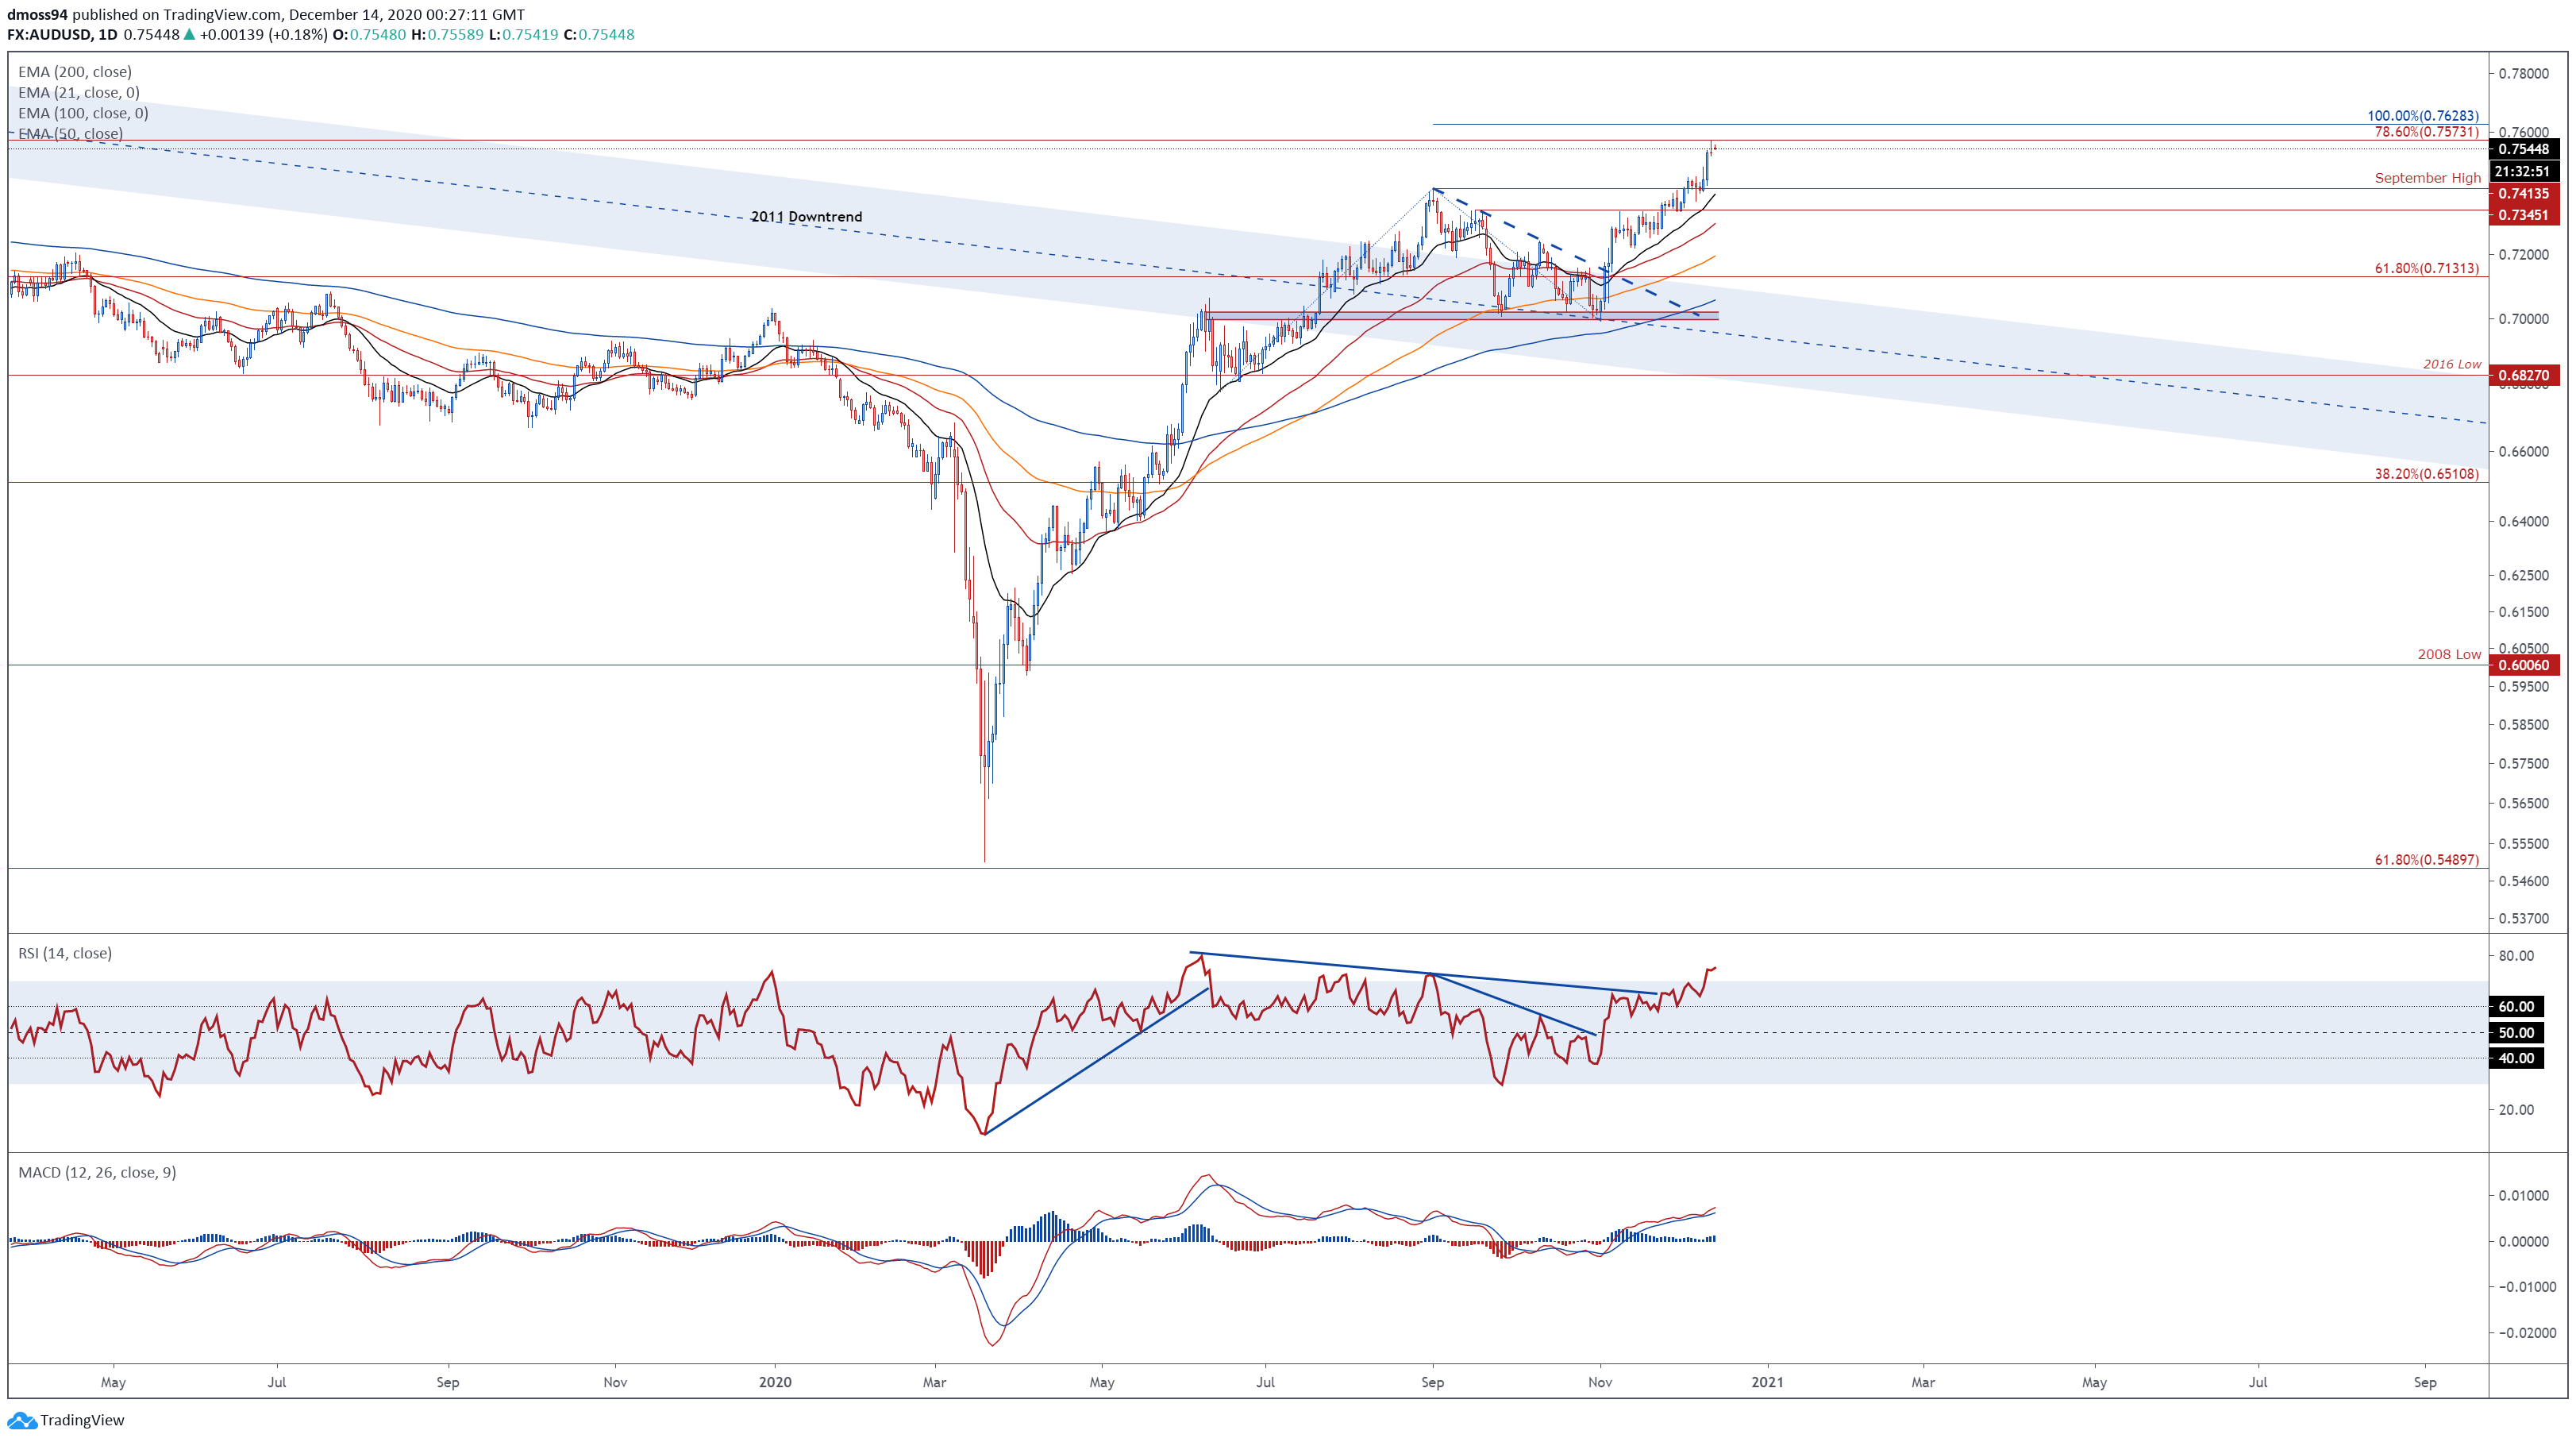
AUD/USD daily chart created using Tradingview
The daily timeframe also hints at further upside for AUD/USD rates, as prices storm away from support at the September high (0.7413) and begin to probe resistance at the 78.6% Fibonacci (0.7573).
However, with price fulfilling the Descending Triangle’s measured move (0.7570), and the RSI failing to follow price to higher highs, a short-term pullback could be in the offing.
Failure to hurdle Fibonacci resistance could inspire a correction back towards psychological support at 0.7500, with a break below bringing the December 7 high (0.7454) into the crosshairs.
Conversely, a convincing break above 0.7575 would likely signal the resumption of the primary uptrend and carve a path for prices to test the 100% Fibonacci (0.7628).
Clearing that probably opens the door for buyers to begin probing psychological resistance at 0.7800.
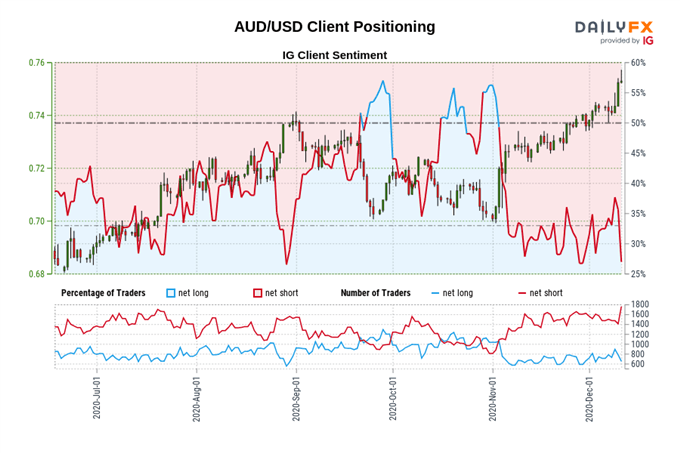
The IG Client Sentiment Report shows 30.07% of traders are net-long with the ratio of traders short to long at 2.33 to 1. The number of traders net-long is 6.27% higher than yesterday and 8.31% lower from last week, while the number of traders net-short is 2.65% lower than yesterday and 6.95% higher from last week.
We typically take a contrarian view to crowd sentiment, and the fact traders are net-short suggests AUD/USD prices may continue to rise.
Positioning is less net-short than yesterday but more net-short from last week. The combination of current sentiment and recent changes gives us a further mixed AUD/USD trading bias.
-- Written by Daniel Moss, Analyst for DailyFX
Follow me on Twitter @DanielGMoss


