


Australian Dollar, AUD/USD, AUD/JPY, AUD/CHF, Technical Analysis – Talking Points:
- AUD/CHF eyeing a push to challenge the 200-week moving average.
- Inverse Head and Shoulders pattern hints at extended gains for AUD/JPY.
- AUD/USD poised to climb to fresh multi-year highs after slicing through key resistance.

As mentioned in previous reports, Australia’s success in suppressing the novel coronavirus, in tandem with soaring commodity prices, may underpin the cyclically-sensitive AUD in the coming months. Bullish technical setups across multiple Australian Dollar crosses also suggest that the currency is poised to continue outperforming its haven-associated counterparts. Here are the technical levels to watch for AUD/CHF, AUD/JPY and AUD/USD rates.
AUD/CHF Weekly Chart – 200-MA in the Crosshairs

AUD/CHF weekly chart created using Tradingview
The weekly chart suggests that further gains are on the horizon for AUD/CHF rates, as buyers push price through psychological resistance at 0.6800 and the September 2018 low (0.6875).
With the RSI climbing to its highest levels since late-2014, and a bullish crossover taking place on the MACD indicator, the path of least resistance seems to favour the upside.
A weekly close above 0.6900 would probably pave the way for price to challenge the sentiment-defining 200-week moving average (0.9099). Clearing that opens the door for buyers to probe the 6.8% Fibonacci expansion (0.7237).
Conversely, sliding back below 0.6875 could neutralize near-term buying pressure and trigger a pullback to the 8-week exponential moving average (0.6774) and former resistance-turned-support at the June 2020 high (0.6743).
AUD/CHF Daily Chart – Ascending Channel Guiding Price Higher

AUD/CHF daily chart created using Tradingview
Zooming into a daily chart bolsters the bullish outlook depicted on the weekly timeframe, as the exchange rate continues to track within the confines of an Ascending Channel.
The development of the RSI and MACD are also indicative of swelling bullish momentum, as both oscillators push to their highest respective levels since August 2020.
Gaining a firm foothold on a daily basis above 0.6900 would likely bring the July 2019 high (0.6955) into focus. A convincing break above carving a path for buyers to test the 50% Fibonacci (0.7072).
Alternatively, if psychological resistance at 0.6900 holds firms, a pullback to confluent support at the 8-EMA (0.6853) and channel midpoint could be on the cards. Hurdling that potentially triggers a push back towards the January low (0.6753).
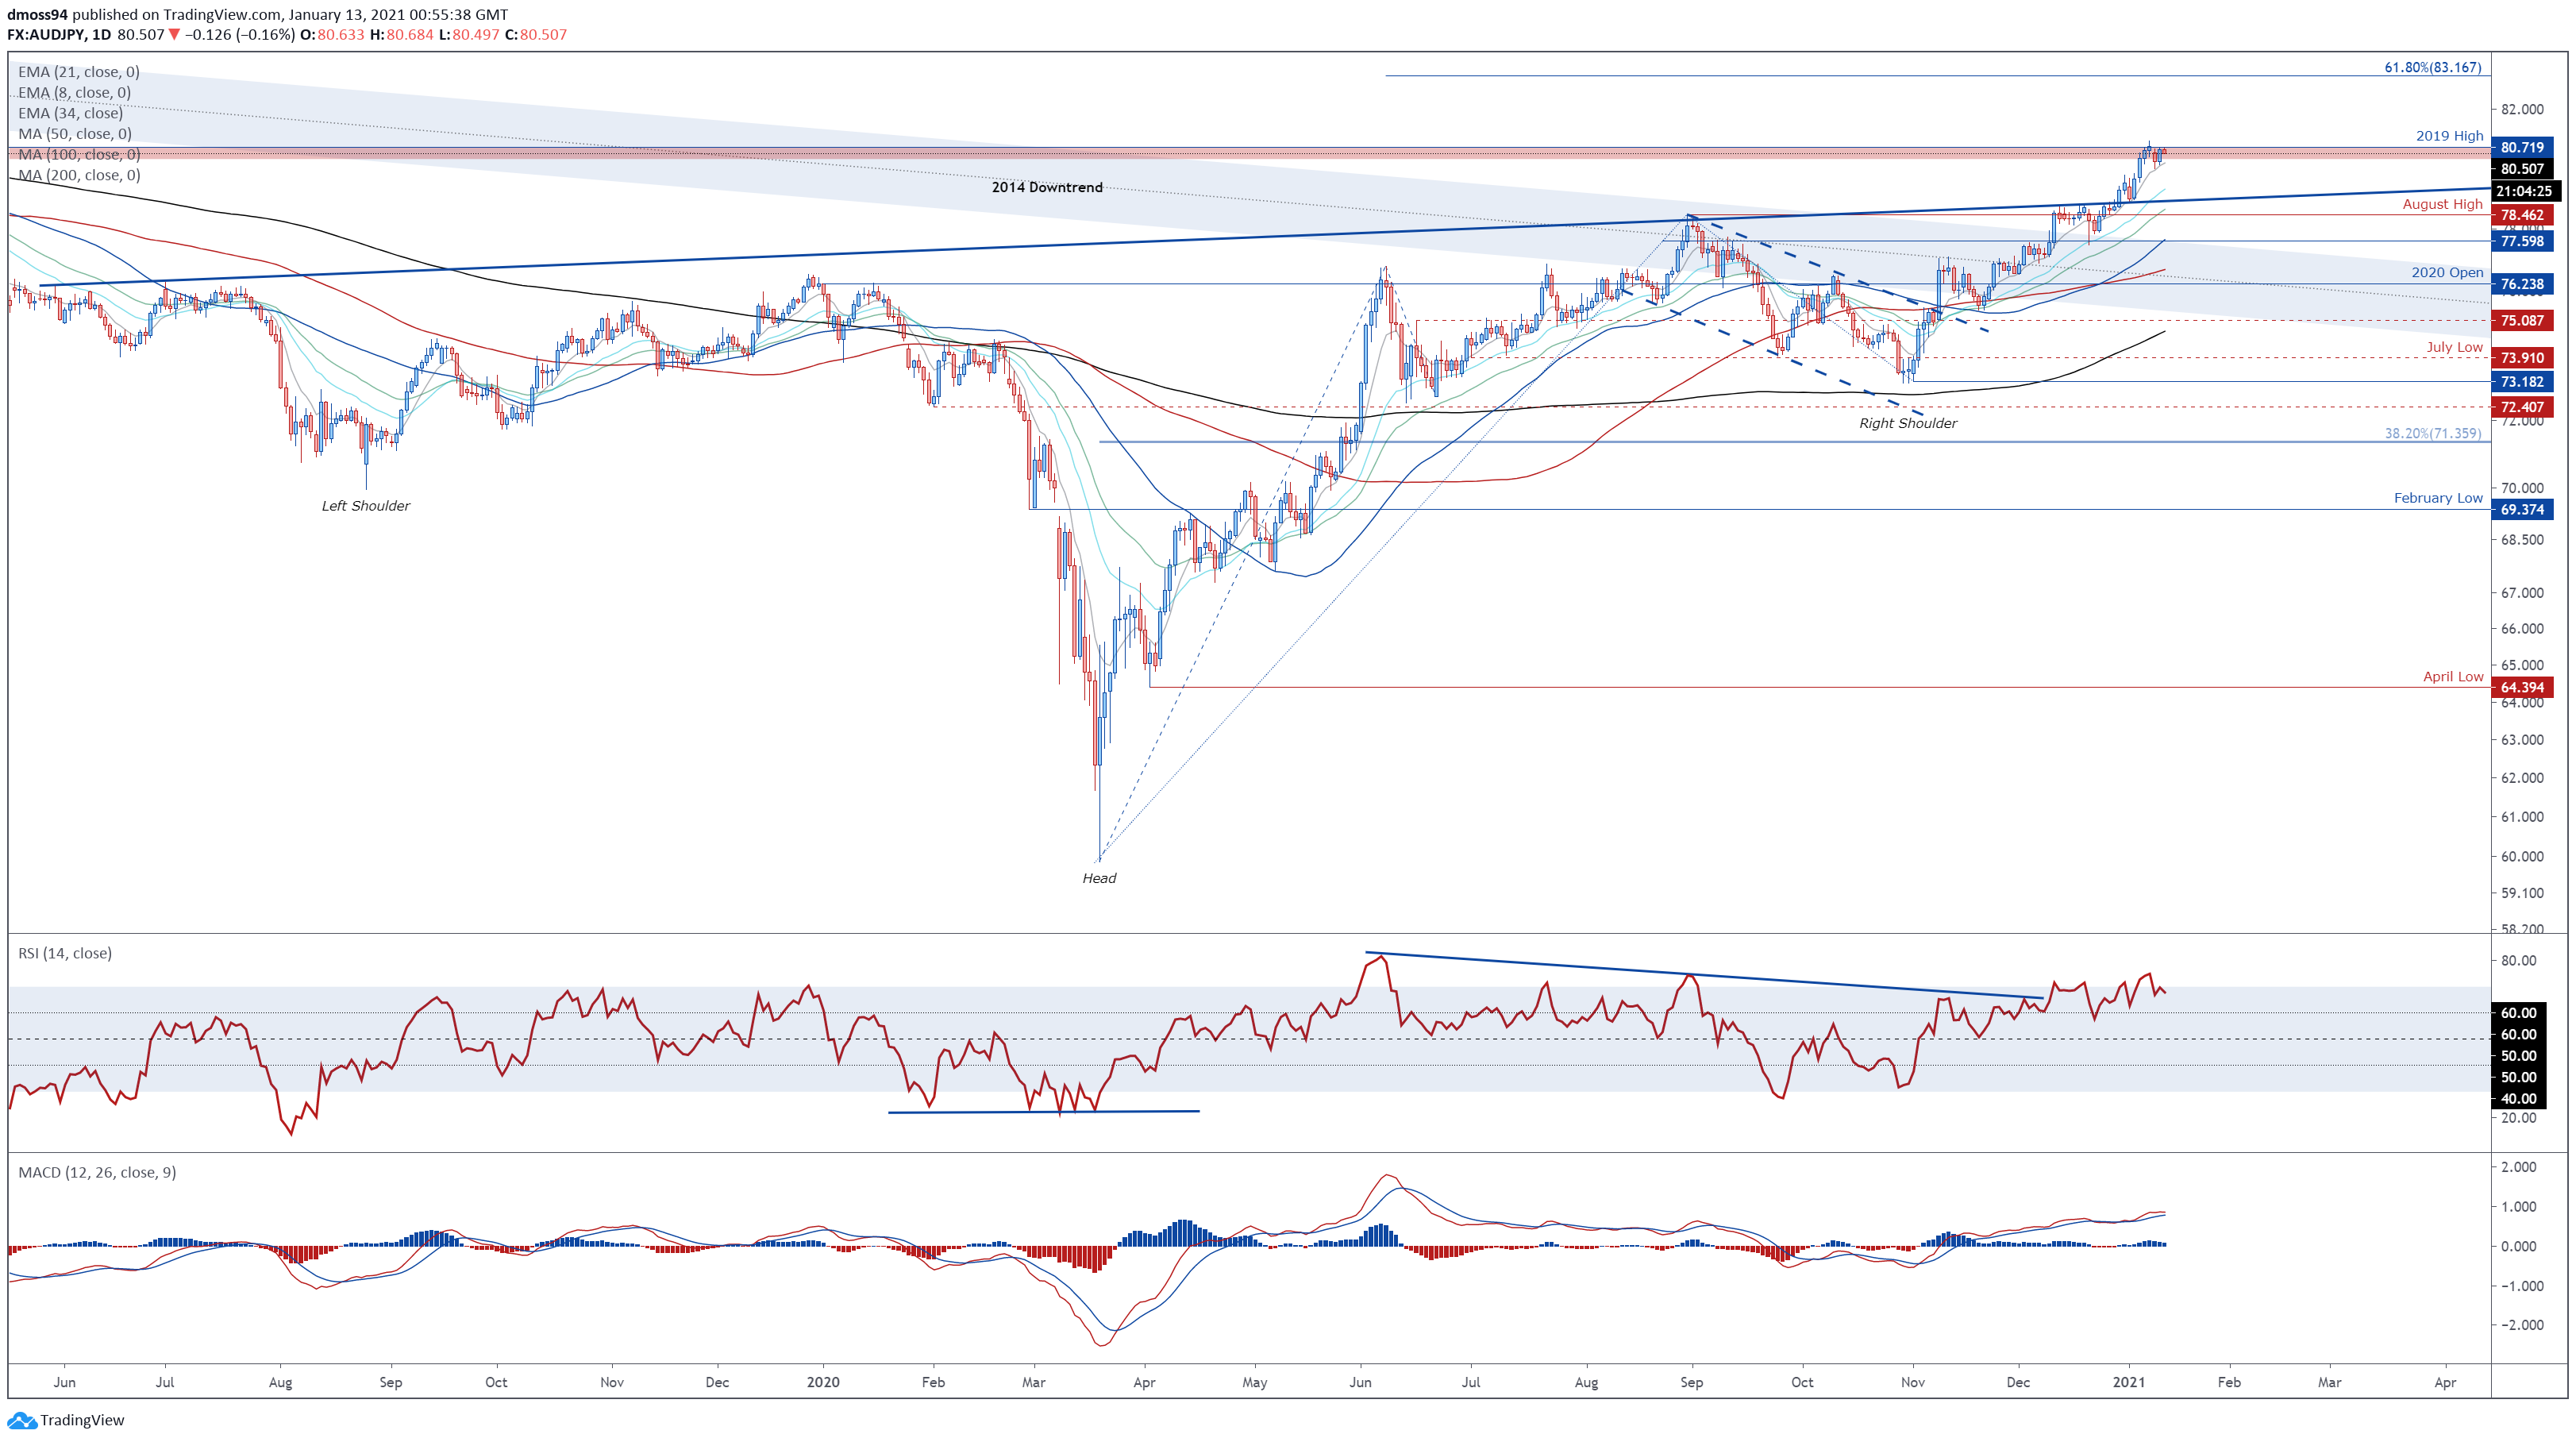
AUD/JPY Weekly Chart – Inverse Head & Shoulders Implies Extended Gains

AUD/JPY weekly chart created using Tradingview
AUD/JPY also looks poised to extend is recent surge higher after breaching the neckline of the inverse Head & Shoulders reversal pattern carved out over the last 18 months.
With prices storming above the sentiment-defining 200-week MA (79.06), and the RSI eyeing a push into overbought territory for the first time since 2013, an impulsive push higher looks likely in the near term.
A weekly close above the 2019 high (80.72) would likely propel price towards psychological resistance at 82.00. Piercing that probably generates a more extended climb to challenge the 61.8% Fibonacci (84.70).
The inverse Head & Shoulders implied measured move suggesting AUD/JPY could climb a further 20% from current levels to test the 2015 high (97.65).
On the contrary, a retest of neckline resistance-turned-support and the 200-MA (79.06) could be on the cards if the 2019 high (80.72) successfully stifles buying pressure.
AUD/JPY Daily Chart – Near-Term Pullback at Hand?
AUD/JPY daily chart created using Tradingview
However, jumping into the daily timeframe suggests a short-term pullback could be in the making, as price struggles to hurdle key resistance at the 2019 high (80.72).
With the RSI dipping back below 70, and the MACD eyeing a bearish cross below its ‘slower’ signal line counterpart, the recent climb higher appears to be running out of steam.
Inability to gain a firm foothold above the 2019 high on a daily close basis may allow sellers to drive prices back towards the 8-day EMA (80.18) and January 11 low (79.99). Clearing these support levels probably triggers a more extended pullback towards the monthly low (78.85).
On the other hand, piercing the January high (80.93) would likely signal the resumption of the primary uptrend and bring the 61.8% Fibonacci expansion (83.17) into play.
AUD/USD Weekly Chart – Golden Cross Indicative of Swelling Bullish Momentum
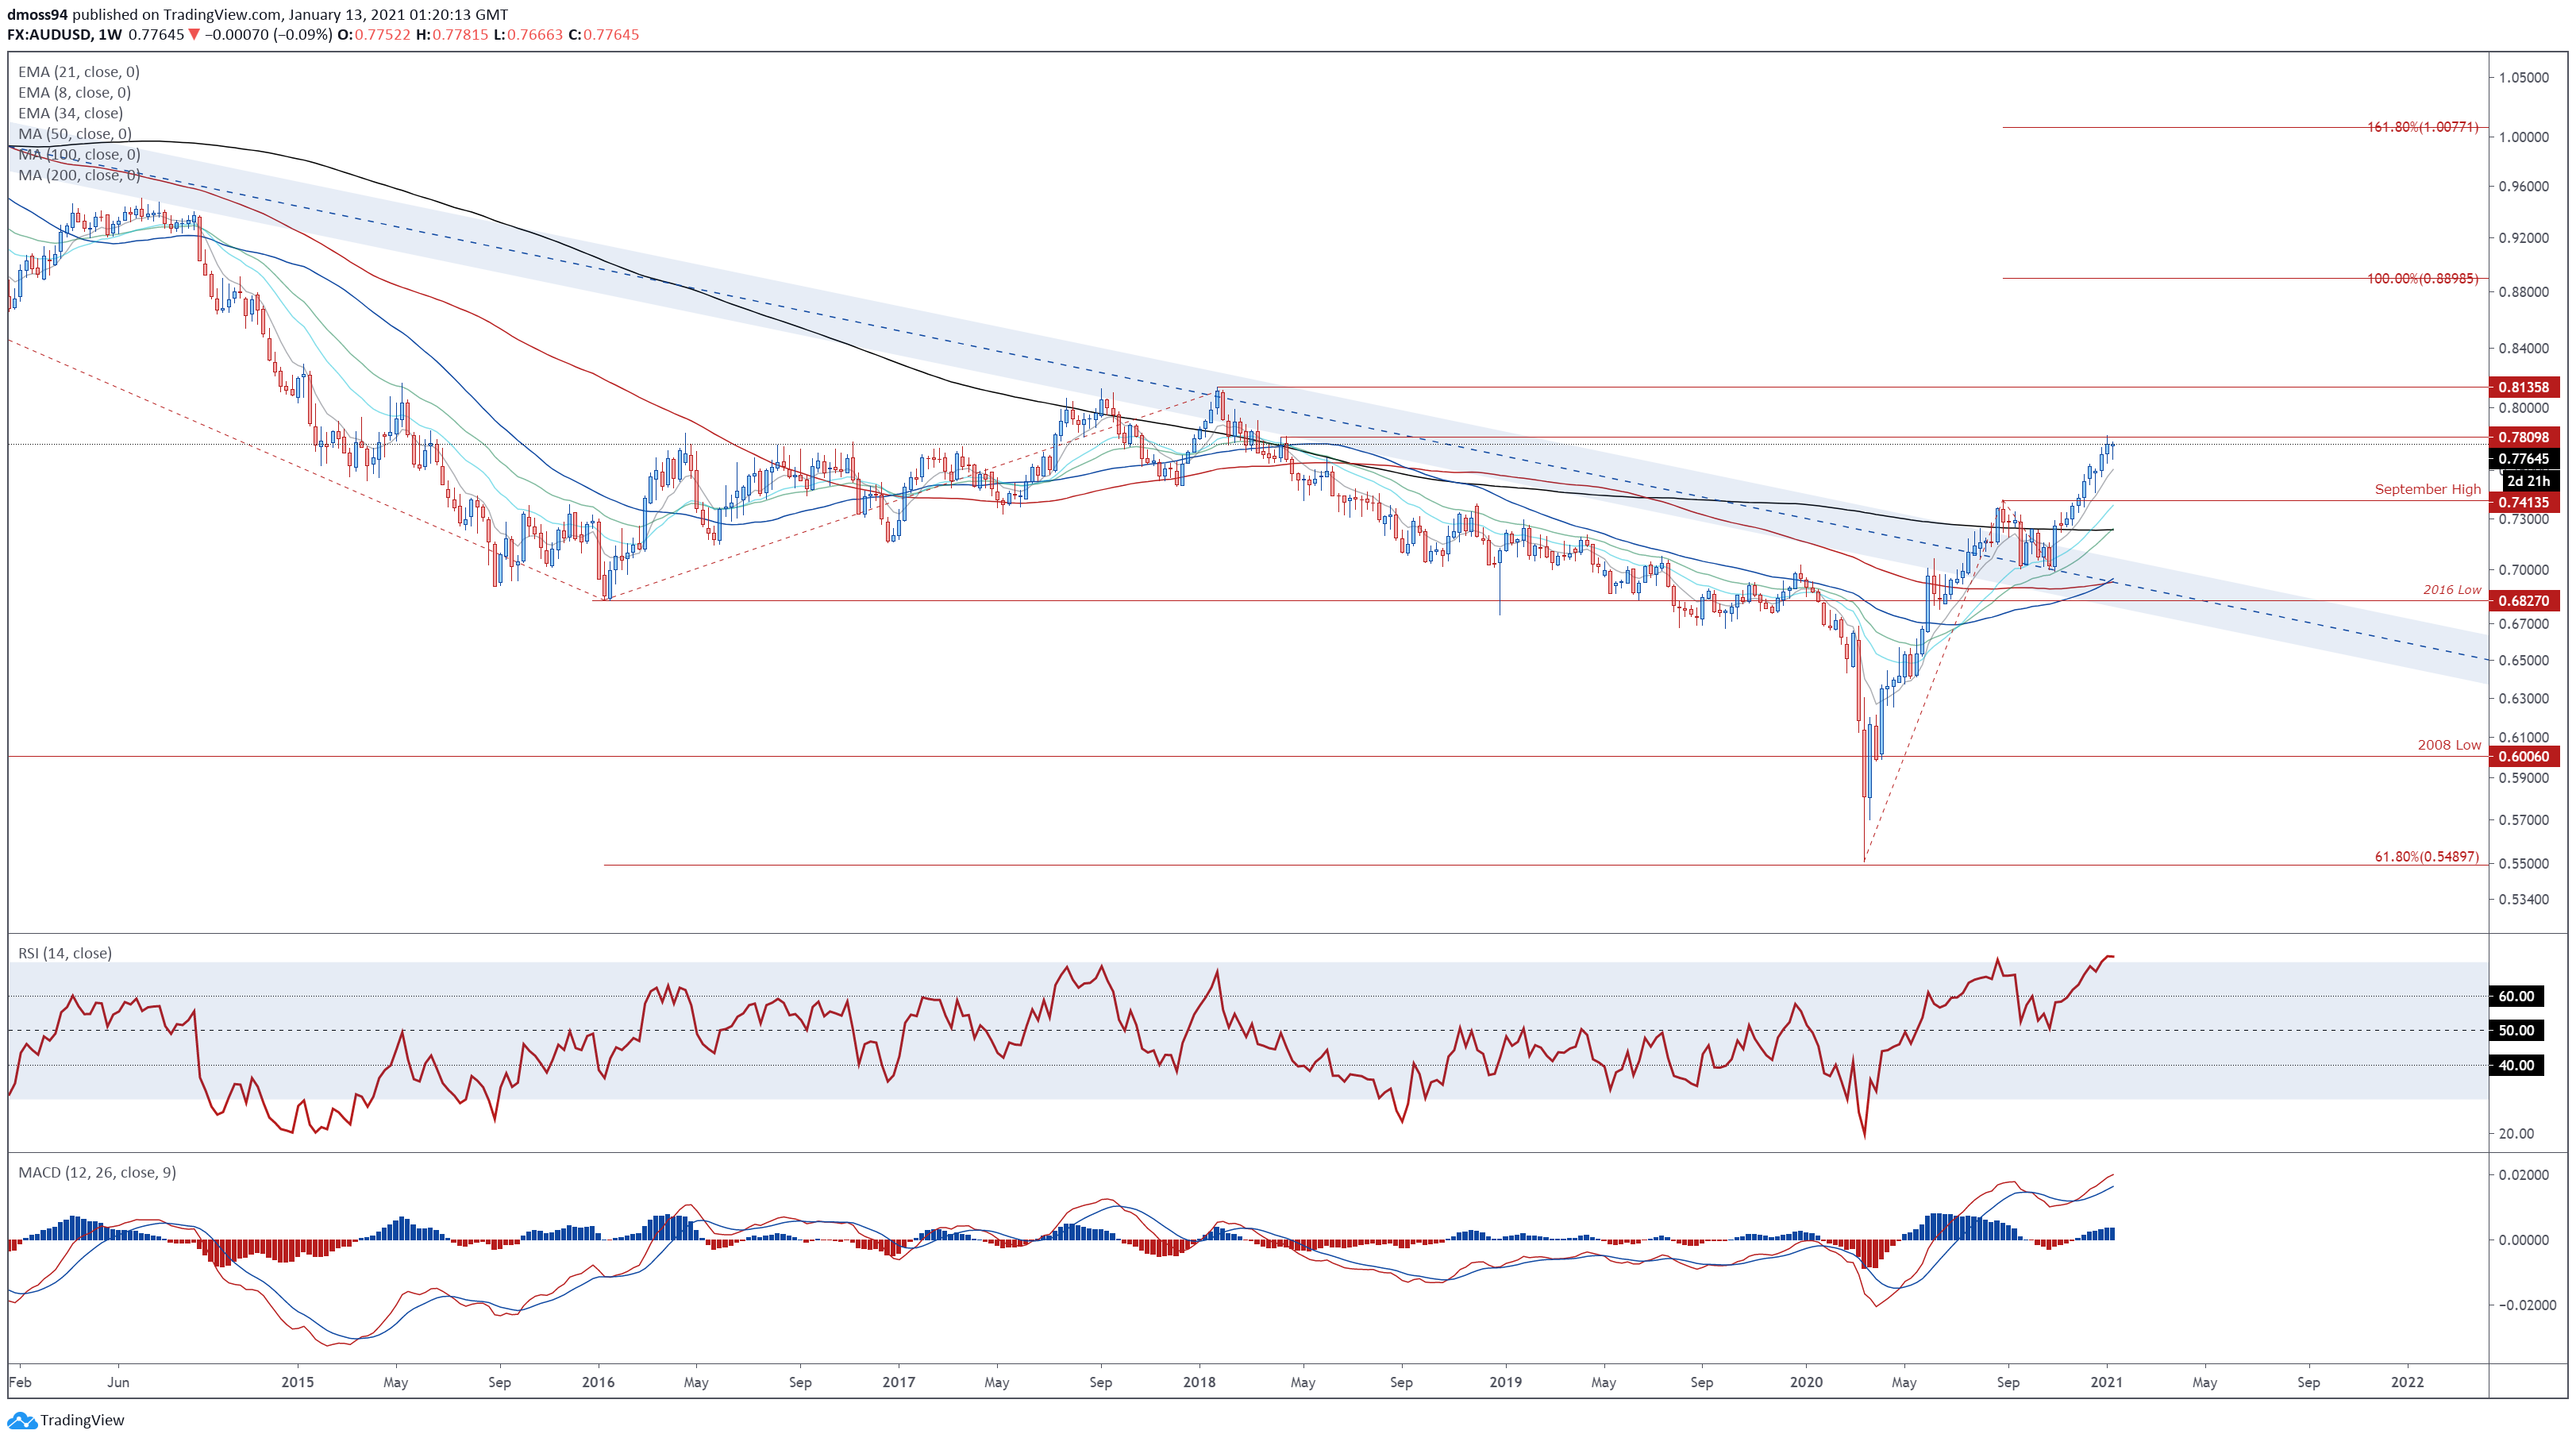
AUD/USD weekly chart created using Tradingview
The AUD/USD exchange rate also looks set to continue climbing higher in the medium to long term, as price slices back above the sentiment-defining 200-MA (0.7237) and September high (0.7413).
With the RSI and MACD indicator storming to their highest respective levels since 2011, the path of least resistance continues to heavily favour the upside.
However, with AUD/USD struggling to breach the April 2018 high (0.7810), a short-term correction back towards the 8-week EMA (0.7608) could be in the offing. Slicing through that may allow sellers to regain control of the exchange rate and drive it back towards former resistance-turned-support at the September high (0.7413).
That being said, with a bullish ‘golden cross’ formation taking place on the moving averages, an extended pullback seems relatively unlikely. With that in mind, a weekly close above 0.7810 would likely signal the resumption of the uptrend extending from the March 2020 nadir and bring the 2018 high (0.8136) into focus.
AUD/USD Daily Chart – Bullish MA Stacking Suggests Further Gains on the Horizon
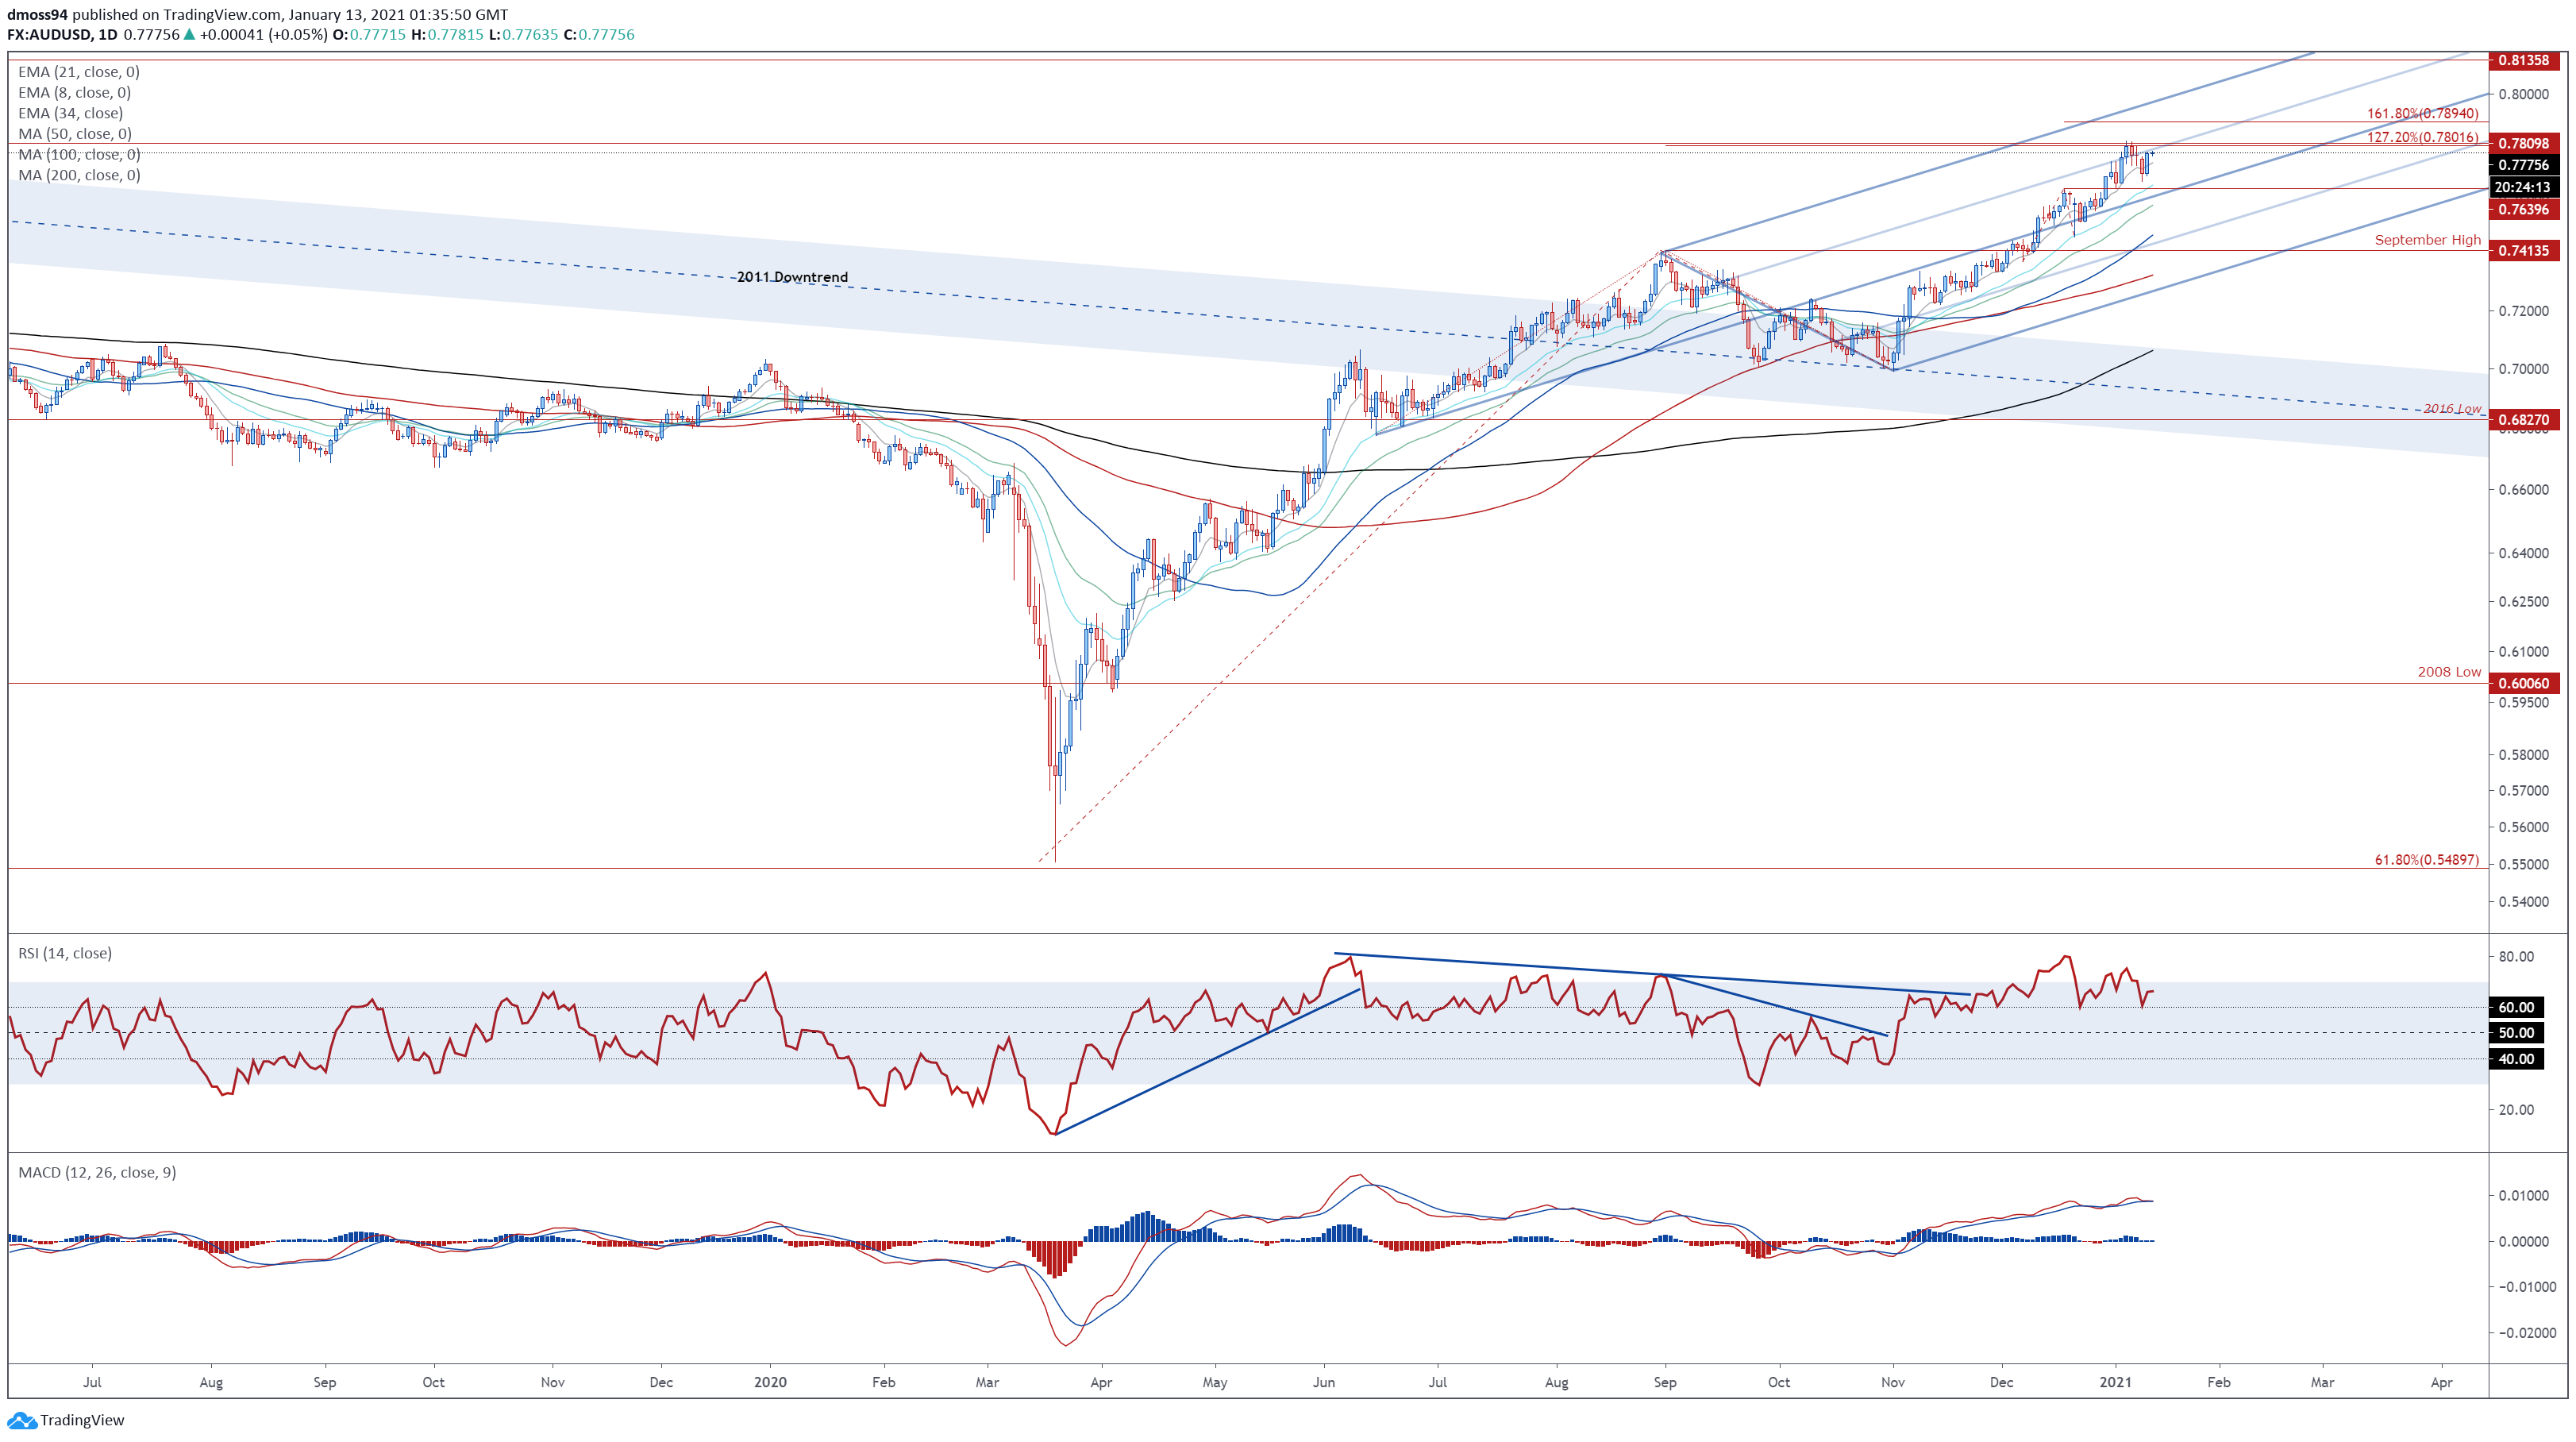
AUD/USD daily chart created using Tradingview
Scrolling into the daily timeframe reinforces the bullish outlook depicted on the weekly chart, as price remains constructively perched above psychological support at 0.7700.
Bullish MA stacking, in tandem with both the RSI and MACD indicator tracking firmly above their respective neutral midpoints, is indicative of swelling bullish momentum.
Therefore, a daily close above the January 6 high (0.7820) would likely ignite a topside push to challenge the 161.8% Fibonacci (0.7894). Hurdling that opens the door for price to probe the psychologically imposing 0.8000 mark.
Alternatively, a pullback towards the monthly low (0.7642) may eventuate if sellers successfully drive AUD/USD back below the 8-day EMA (0.7738).
-- Written by Daniel Moss, Analyst for DailyFX
Follow me on Twitter @DanielGMoss

https://www.dailyfx.com/education/support-and-resistance/psychological-levels-and-round-numbers.html?ref-author=Moss


