


AUD/USD TECHNICAL OUTLOOK: BEARISH
- Australian Dollar may be ready to resume 2020 downtrend vs. USD
- Break of counter-trend support line puts 0.6214, 0.60 figure in focus
- Trader sentiment studies warning sellers to proceed with caution
The Australian Dollar turned lower after testing trend resistance guiding the currency downward against its US counterpart since the start of the year, as expected. Prices have now broken rising counter-trend support set from the March swing low. That suggests that the dominant bearish bias is set to be reasserted after a corrective recovery has run its course.
From here, a break below below initial resistance-turned-support at 0.6214 – confirmed on a daily closing basis – seems likely to open the door for a challenge of the April 3 low at 0.5980. Neutralizing near-term selling pressure probably requires a daily close above the 0.6434-45 price congestion area, a move that would double as a break of falling trend resistance.
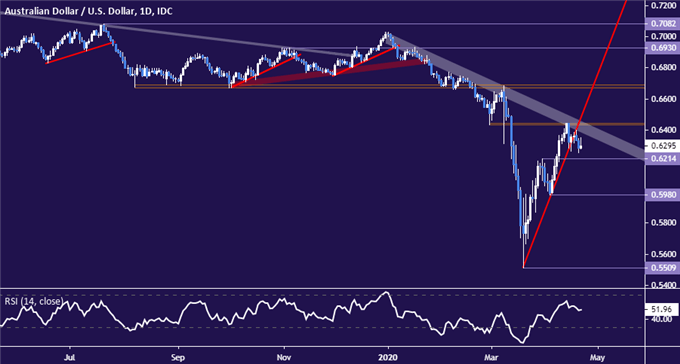
AUD/USD daily chart created with TradingView
Turning to the four-hour chart for a glance at more immediate positioning, prices seem to be coiling up within a Descending Triangle chart formation after clearing two layers of upward-sloping support. The pattern typically carries bearish implications. Confirmation with a break below its lower bound as well as the 0.6200-14 region may set the stage for follow-through.
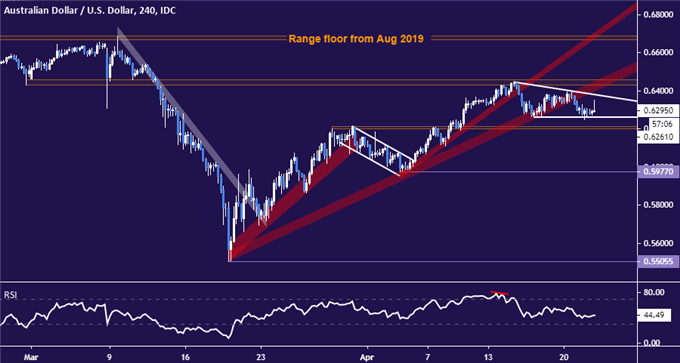
AUD/USD 4-hour chart created with TradingView
AUD/USD TRADER SENTIMENT
Would-be sellers might be wise to proceed with caution however. Retail sentiment data shows 61.1% of traders are net-short, with the short-to-long ratio at 1.57 to 1. IG Client Sentiment (IGCS) is typically used as a contrarian indicator, so traders being net-short suggests a bullish AUD/USD trend bias. Further, the net-short skew has grown from yesterday and a week ago, bolstering the case for an upside scenario.
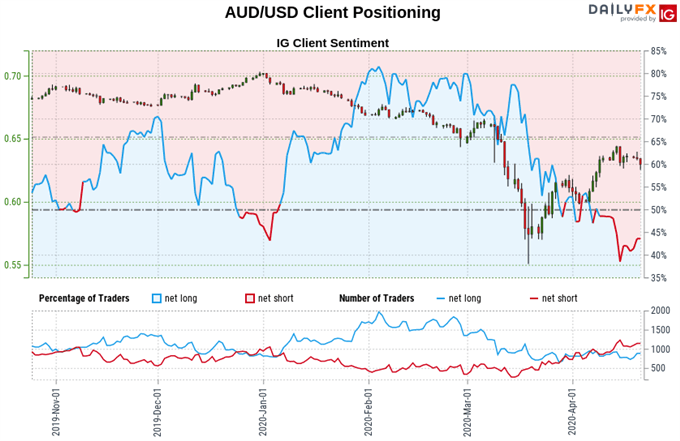
See the full IGCS sentiment report here.

FX TRADING RESOURCES
- Just getting started? See our beginners’ guide for FX traders
- Having trouble with your strategy? Here’s the #1 mistake that traders make
- Join a free live webinar and have your trading questions answered
--- Written by Ilya Spivak, Currency Strategist for DailyFX.com
To contact Ilya, use the comments section below or @IlyaSpivak on Twitter


