


AUD/USD TECHNICAL OUTLOOK: BEARISH
- Australian Dollar breaks bounds of 4-month rebound vs US namesake
- Long-term positioning suggests structural downtrend may be resuming
- Initial resistance just below 0.69 but pivotal ceiling remains at 0.7032
The Australian Dollar may accelerate downward against its US counterpart having broken support guiding the recovery from lows set in early October. Prices marked a top above the 0.70 figure with the formation of a bearish Evening Star candlestick pattern, as expected.
Prices’ inability to build higher even in the wake of better-than-expected local jobs data compounds a sense of underlying weakness, bolstering the case for bearish follow-through. Initial support is at 0.6755, with a daily close below that exposing the 0.6671-90 price floor.
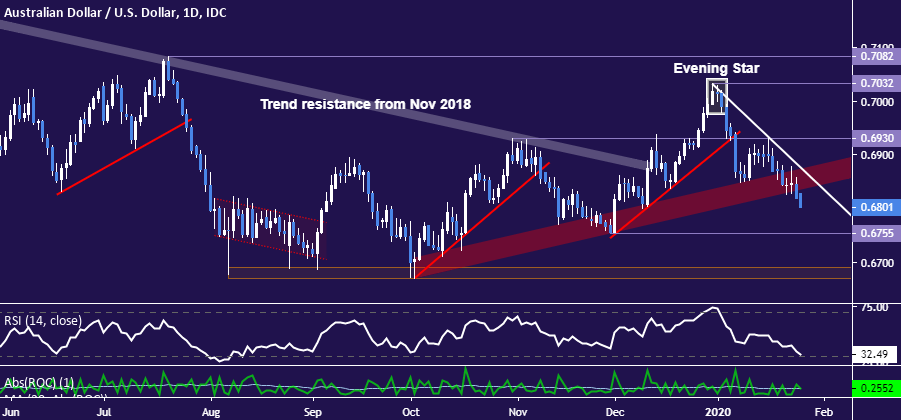
AUD/USD daily chart created with TradingView
Immediate resistance is marked by a falling trend line set form the December 31 swing high, now at 0.6875. Securing a foothold above that – with confirmation on a daily closing basis – puts the inflection barrier at 0.6930 in focus next. Breaching the peak at 0.7032 is probably a truer test of buyers’ mettle however.
Zooming out to the monthly chart reinforces the breakdown’s significance for the long-term trend. It suggests that the structural decline paused in the fourth quarter of 2019 after a break below the 0.6900-0.7018 area has resumed after a corrective retest, warning that a descent into the 0.6001-0.6350 zone may come next.
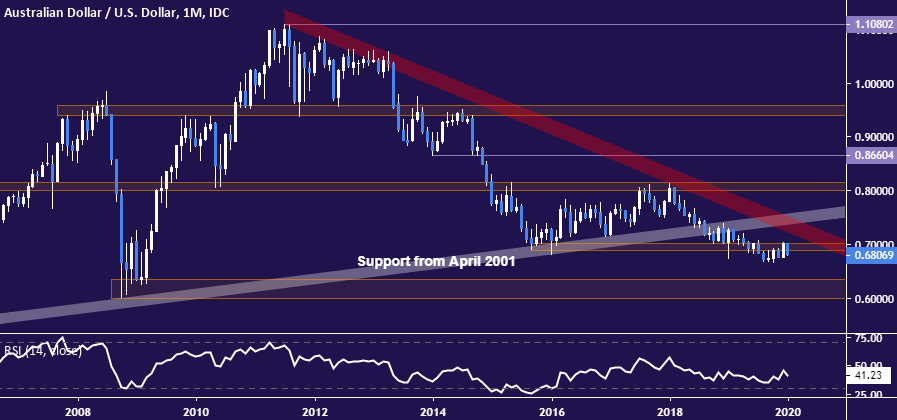
AUD/USD monthly chart created with TradingView
AUD/USD TRADER SENTIMENT
| Change in | Longs | Shorts | OI |
| Daily | 2% | 3% | 2% |
| Weekly | 29% | -46% | 0% |
AUD/USD TRADING RESOURCES
- Just getting started? See our beginners’ guide for FX traders
- Having trouble with your strategy? Here’s the #1 mistake that traders make
- Join a free live webinar and have your trading questions answered
--- Written by Ilya Spivak, Currency Strategist for DailyFX.com
To contact Ilya, use the comments section below or @IlyaSpivak on Twitter


