


AUD/USD TECHNICAL OUTLOOK: BEARISH
- Aussie Dollar threatening four-month support against its US namesake
- Break confirmed on a daily close may signal bearish trend resumption
- Long-term chart setup continues to suggest sellers have the upper hand
The Australian Dollar has fallen as expected, building on an initial support break following the formation of a bearish Evening Star candlestick pattern. Prices have touched six-week lows and are now testing the bounds of the uptrend established from October’s swing bottom.
Confirmation of a break below this barrier on a daily closing basis would suggest that a upside correction has run its course, setting the stage for the longer-term downtrend to resume. The first major hurdle facing sellers thereafter lines up in the 0.6671-90 area, a floor in play since early August.

AUD/USD daily chart created with TradingView
Initial resistance is marked by a falling trend line resistance set form the December 31 swing high. Most recently, this barrier has held conspicuously intact in the wake of better-than-expected local jobs data. Securing a foothold above that eyes an inflection barrier at 0.6930 next, followed by the peak at 0.7032.
The monthly chart suggests the overall trajectory still favors depreciation. December marked a retest of support-turned-resistance in the 0.6900-0.7018 area but the structural decline that overturned a 17-year uptrend in mid-2018 remains intact, warning that extension into the 0.6001-0.6350 zone may be ahead.
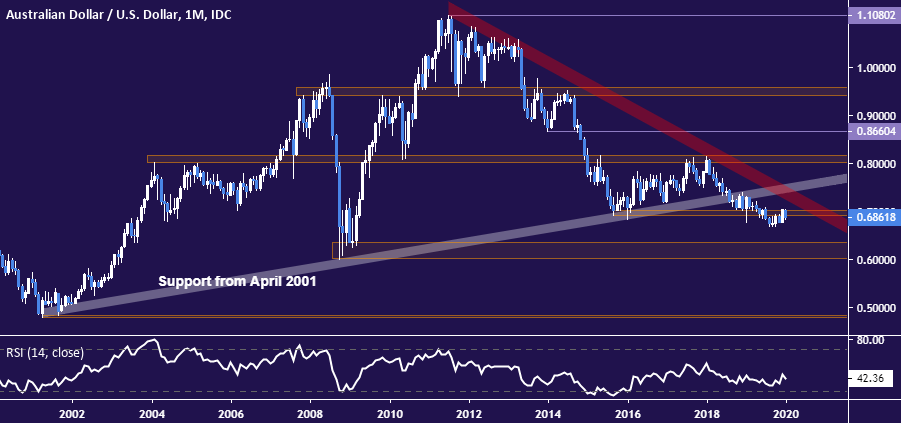
AUD/USD monthly chart created with TradingView
AUD/USD TRADER SENTIMENT
| Change in | Longs | Shorts | OI |
| Daily | 2% | 3% | 2% |
| Weekly | 29% | -46% | 0% |
AUD/USD TRADING RESOURCES
- Just getting started? See our beginners’ guide for FX traders
- Having trouble with your strategy? Here’s the #1 mistake that traders make
- Join a free live webinar and have your trading questions answered
--- Written by Ilya Spivak, Currency Strategist for DailyFX.com
To contact Ilya, use the comments section below or @IlyaSpivak on Twitter


