


Aussie and Kiwi Dollar vs US Dollar Technical Analysis
- US Dollar price action against Australian Dollar and New Zealand Dollar.
- AUD/USD, NZD/USD Charts
Did we get it right with our Gold and USD Dollar forecasts? Find out more for free from Q4 main currencies and commodities forecasts
AUD/USD, NZD/USD – In the Green
Last week, Aussie and Kiwi Dollar corrected higher against US Dollar. On Friday, AUD/USD closed the weekly candlestick with a 0.9% gain. Meanwhile, NZD/USD ended the weekly session with nearly 0.8% gain.
Alongside this, the relative Strength Index (RSI) crossed above 50 reflecting the end of the downtrend momentum, and the start of uptrend move.
Having trouble with your trading strategy? Here’s the #1 Mistake That Traders Make
AUD/USD DAILY PRICE CHART (June 1, 2018 – Oct 22, 2019) Zoomed Out

AUD/USD DAILY PRICE CHART (July 10 – Oct 22, 2019) Zoomed IN
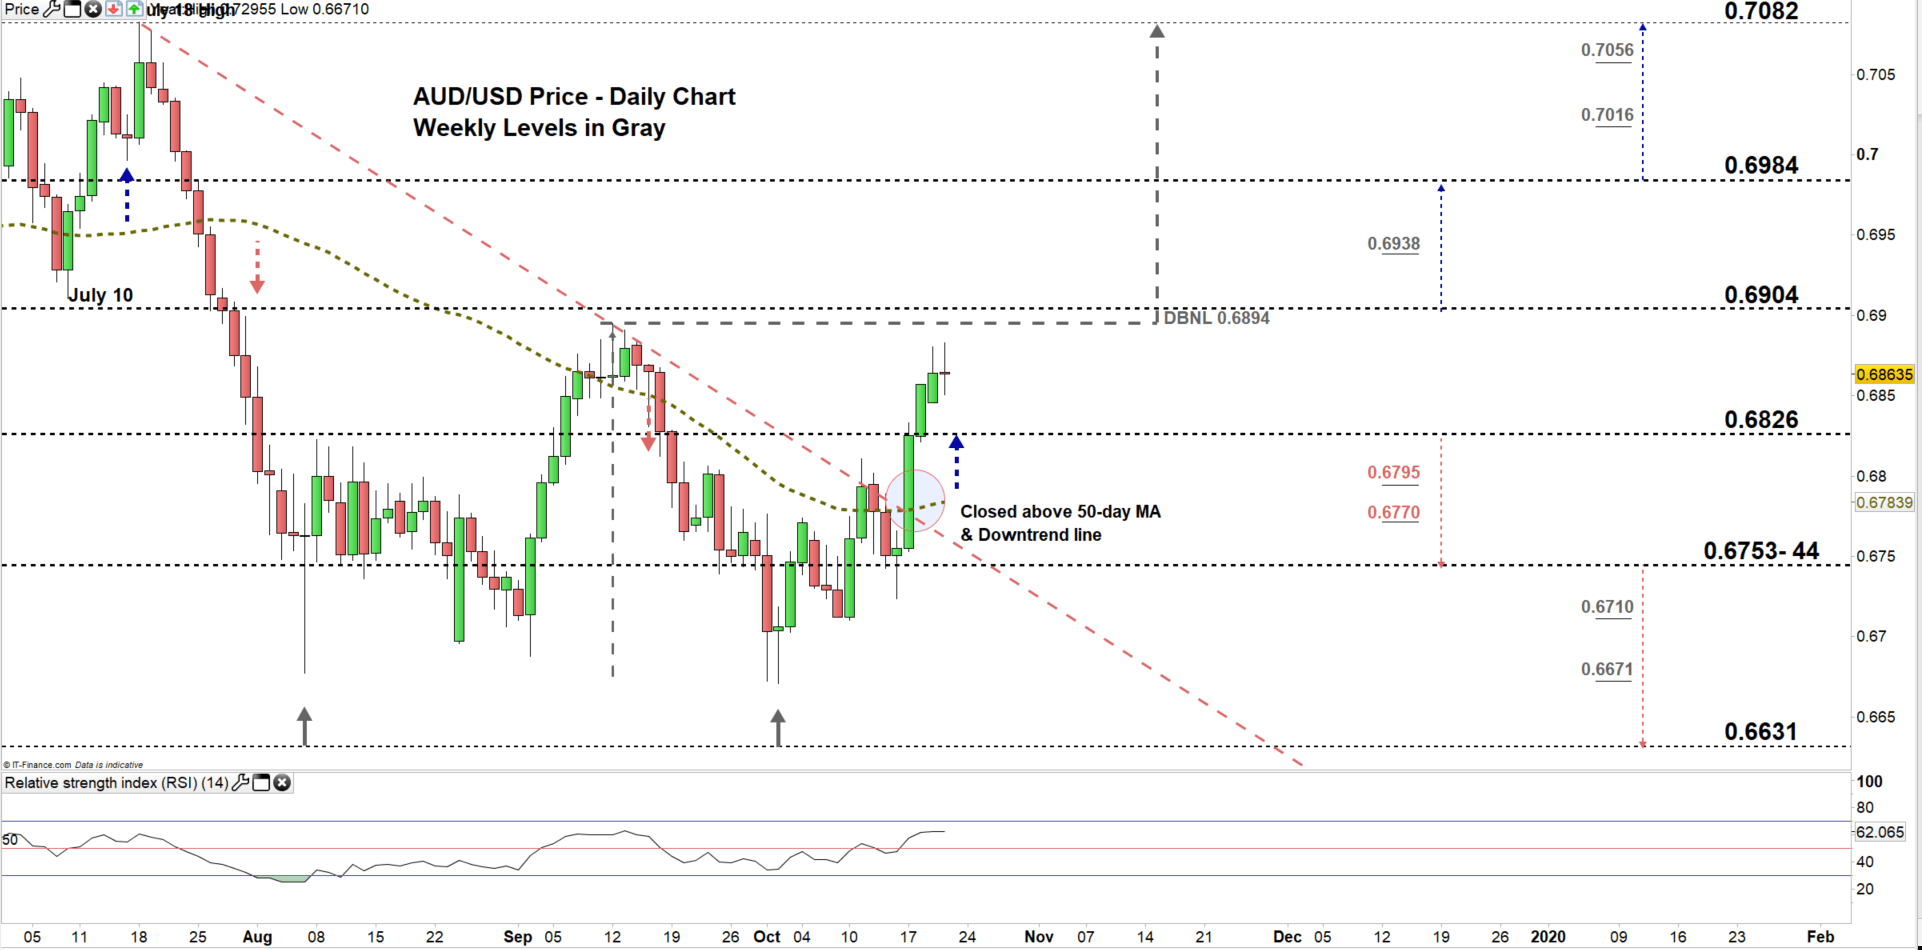
Looking at the daily chart, we notice on Oct 17 AUD/USD broke above the downtrend line originated from the July 18 high at 0.7082 , then closed above 50-day average providing two bullish signals in that day.
On the following day, AUDUSD rallied to a higher trading zone 0.6826 – 0.6904 eyeing a test of the neckline of double top pattern. Therefore, if the price breaks and remains above 0.6894, this could lead the pair towards 0.7082. That said, the weekly resistance levels with the boundaries of the higher trading zone highlighted on the chart (zoomed in) should be watched closely.
On the flip-side, a close below low end of current trading zone would mean buyer’s hesitation. Consequently, this may press AUDUSD towards the vicinity of 0.6753-44. Nevertheless, the daily support levels underscored on the chart should be considered.
Just getting started? See our Beginners’ Guide for FX traders
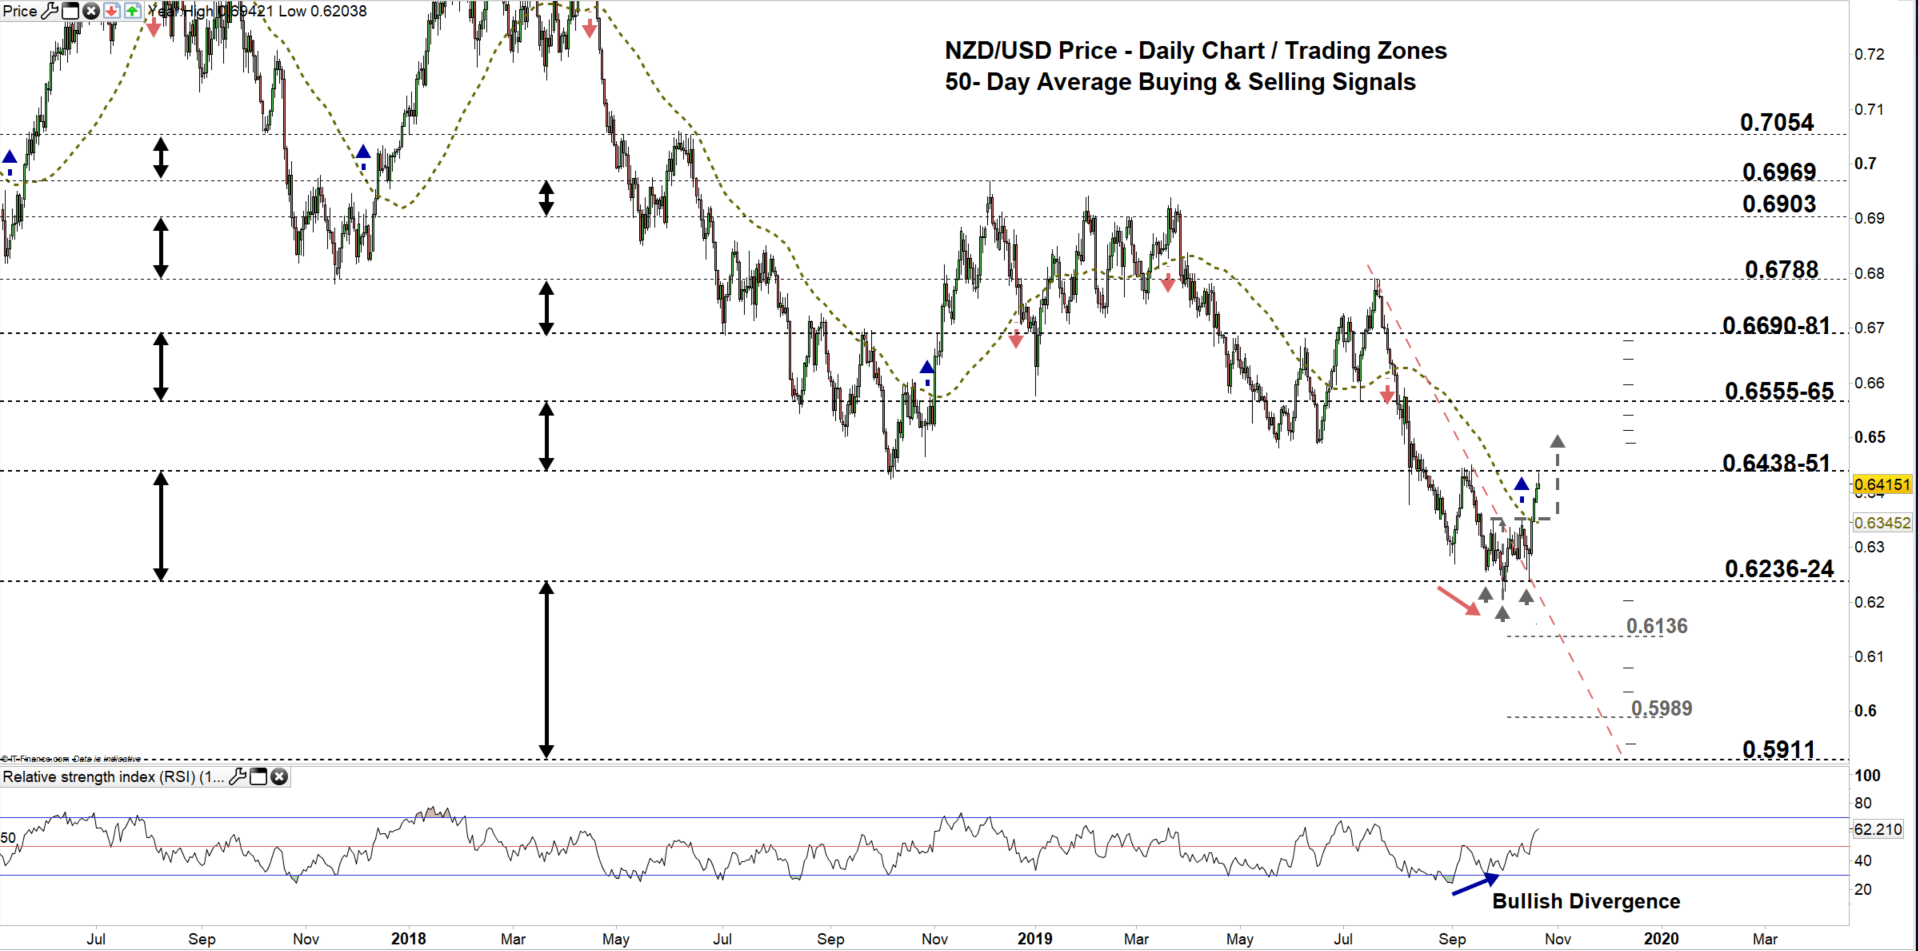
NZD/USD DAILY PRICE CHART (Mar 8, 2017 – Oct 22, 2019) Zoomed Out
NZD/USD DAILY PRICE CHART (JULY 8 – Oct 22, 2019) Zoomed In
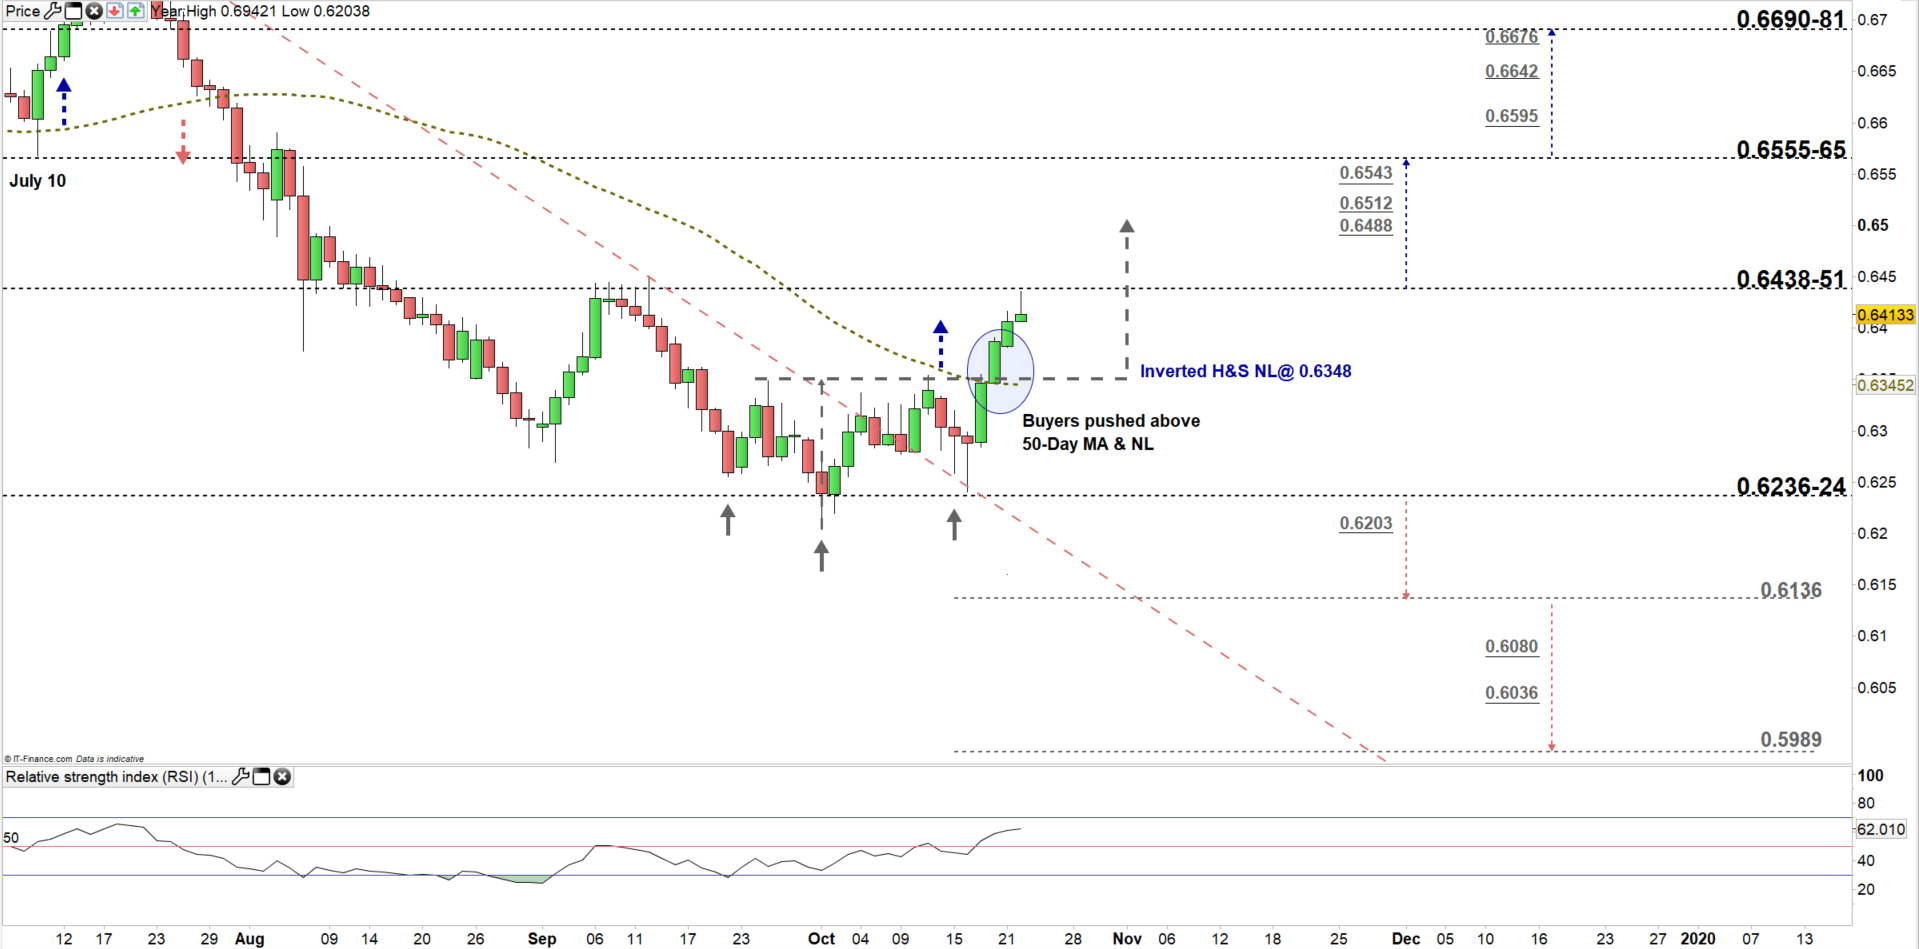
From the daily chart, we notice on Friday Oct 18 NZD/USD rallied above 50-Day average for the first time in over two and a half months. Additionally, the price broke above the neckline of inverted head and shoulders residing at 0.6348 generating a clear bullish signal.
Today, the price rebounded nearby the high end of current trading zone 0.6236 - 0.6438. Thus, a close below the high end may reverse the pair's direction towards the low end. Needless to say, that another close below the aforementioned neckline would negate the inverted head and shoulders pattern.
Having said that, any close above 0.6451 could push NZDUSD towards the vicinity of 0.6555-65. Although, the weekly resistance levels underlined on the chart (zoomed in) should be kept in focus.
Written By: Mahmoud Alkudsi
Please feel free to contact me on Twitter: @Malkudsi


