


AUD/USD Technical Analysis
- Australian Dollar price action against US Dollar
- AUD/USD Charts and analysis
Did we get it right with our Gold and USD Dollar forecasts? Find out more for free from Q4 main currencies and commodities forecasts
AUD/USD – Change of Direction
On Oct 11, AUD/USD corrected higher creating a higher high at 0.6810. On Wednesday, sellers showed hesitation in sending the price lower and this resulted with a higher low at 0.6723.
Alongside this, the relative Strength Index (RSI) crossed above 50 highlighting the end of downtrend move with a possible start of uptrend momentum.
Having trouble with your trading strategy? Here’s the #1 Mistake That Traders Make
AUD/USD DAILY PRICE CHART (July 15, 2018 – Oct 18, 2019) Zoomed Out

AUD/USD DAILY PRICE CHART (July 12 – Oct 18, 2019) Zoomed IN
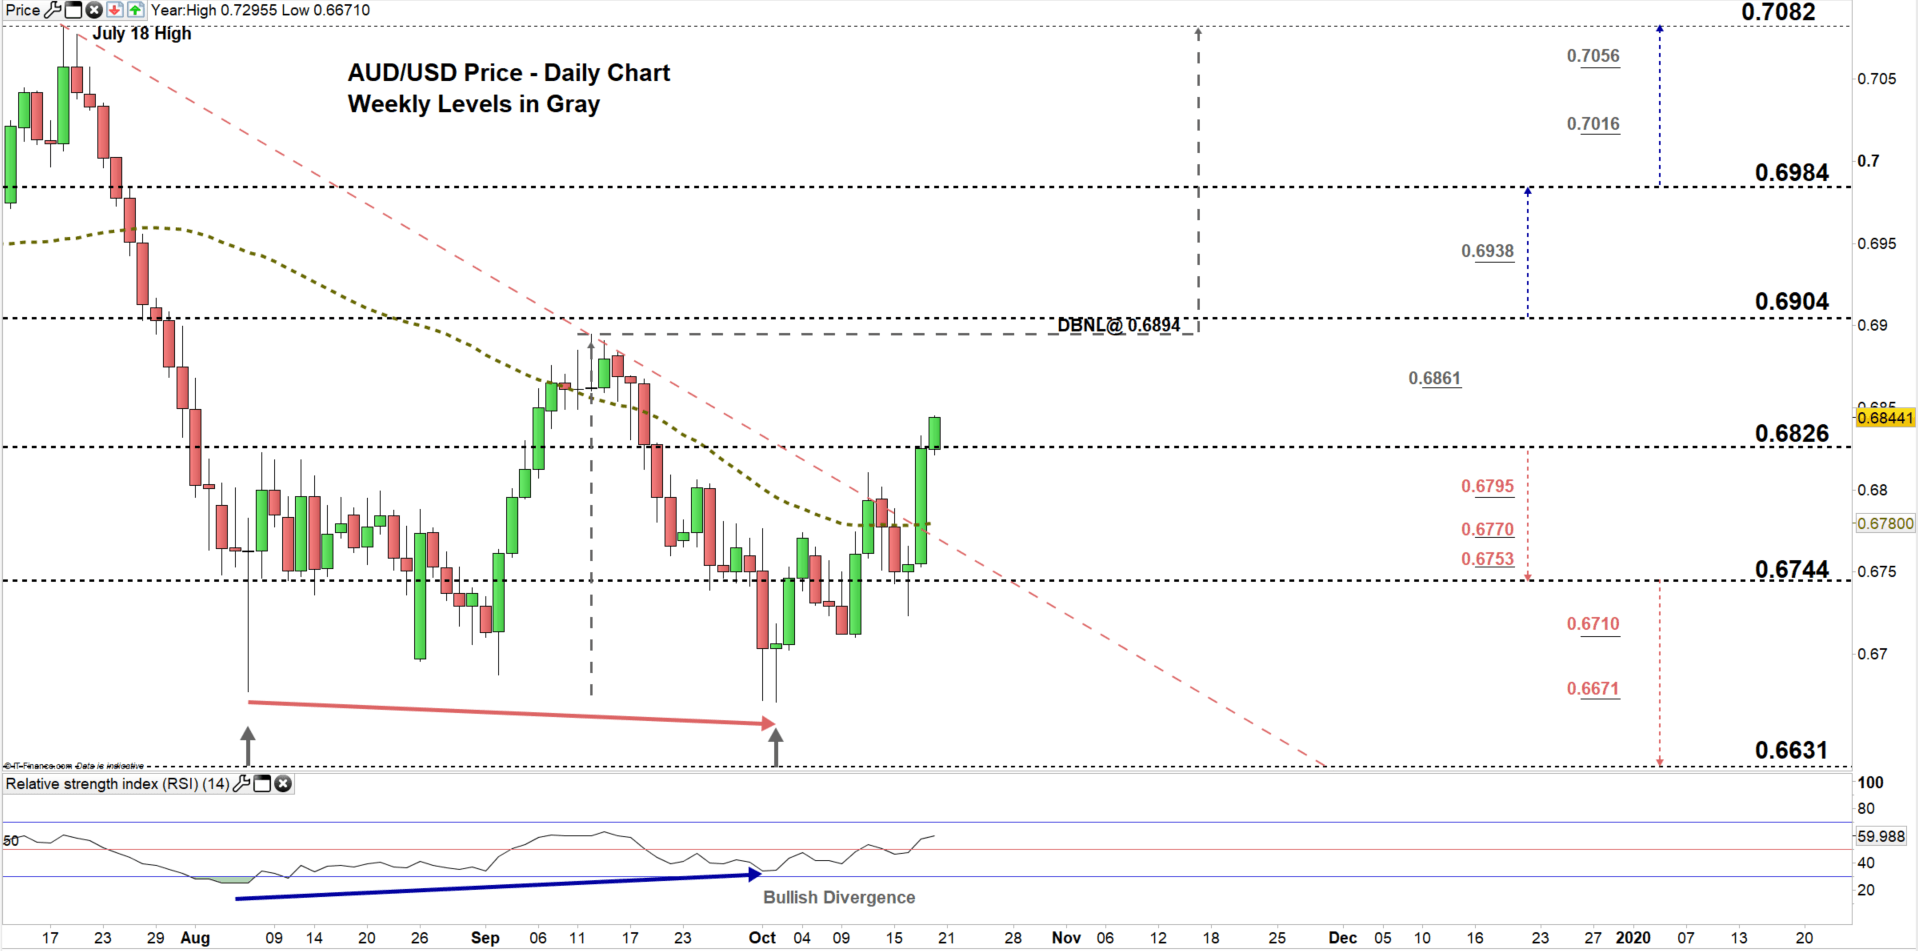
Looking at the daily chart, we notice yesterday AUD/USD broke above the downtrend line originated from the July 18 high at 0.7082 then closed above the 50-Day average generating a clear bullish signal.
Today, the pair rallied to a higher trading zone 0.6826 – 0.6904. Thus, a close above the low end of the zone may push AUDUSD towards the high-end contingent on clearing the weekly resistance levels marked on the chart (zoomed in).
If the price breaks and remains above the above the neckline of the double top pattern located at 0.6894, this could lead AUDUSD towards 0.7082. That said, the weekly resistance levels marked on the chart should be kept in focus.
In turn, any failure in closing above the low end of the zone could entice sellers to press AUDUSD towards 0.6744. Nevertheless, the daily support levels underlined on the chart should be watched closely.
Just getting started? See our Beginners’ Guide for FX traders
AUD/USD Four-Hour PRICE CHART (AUG 13 – Oct 18, 2019)
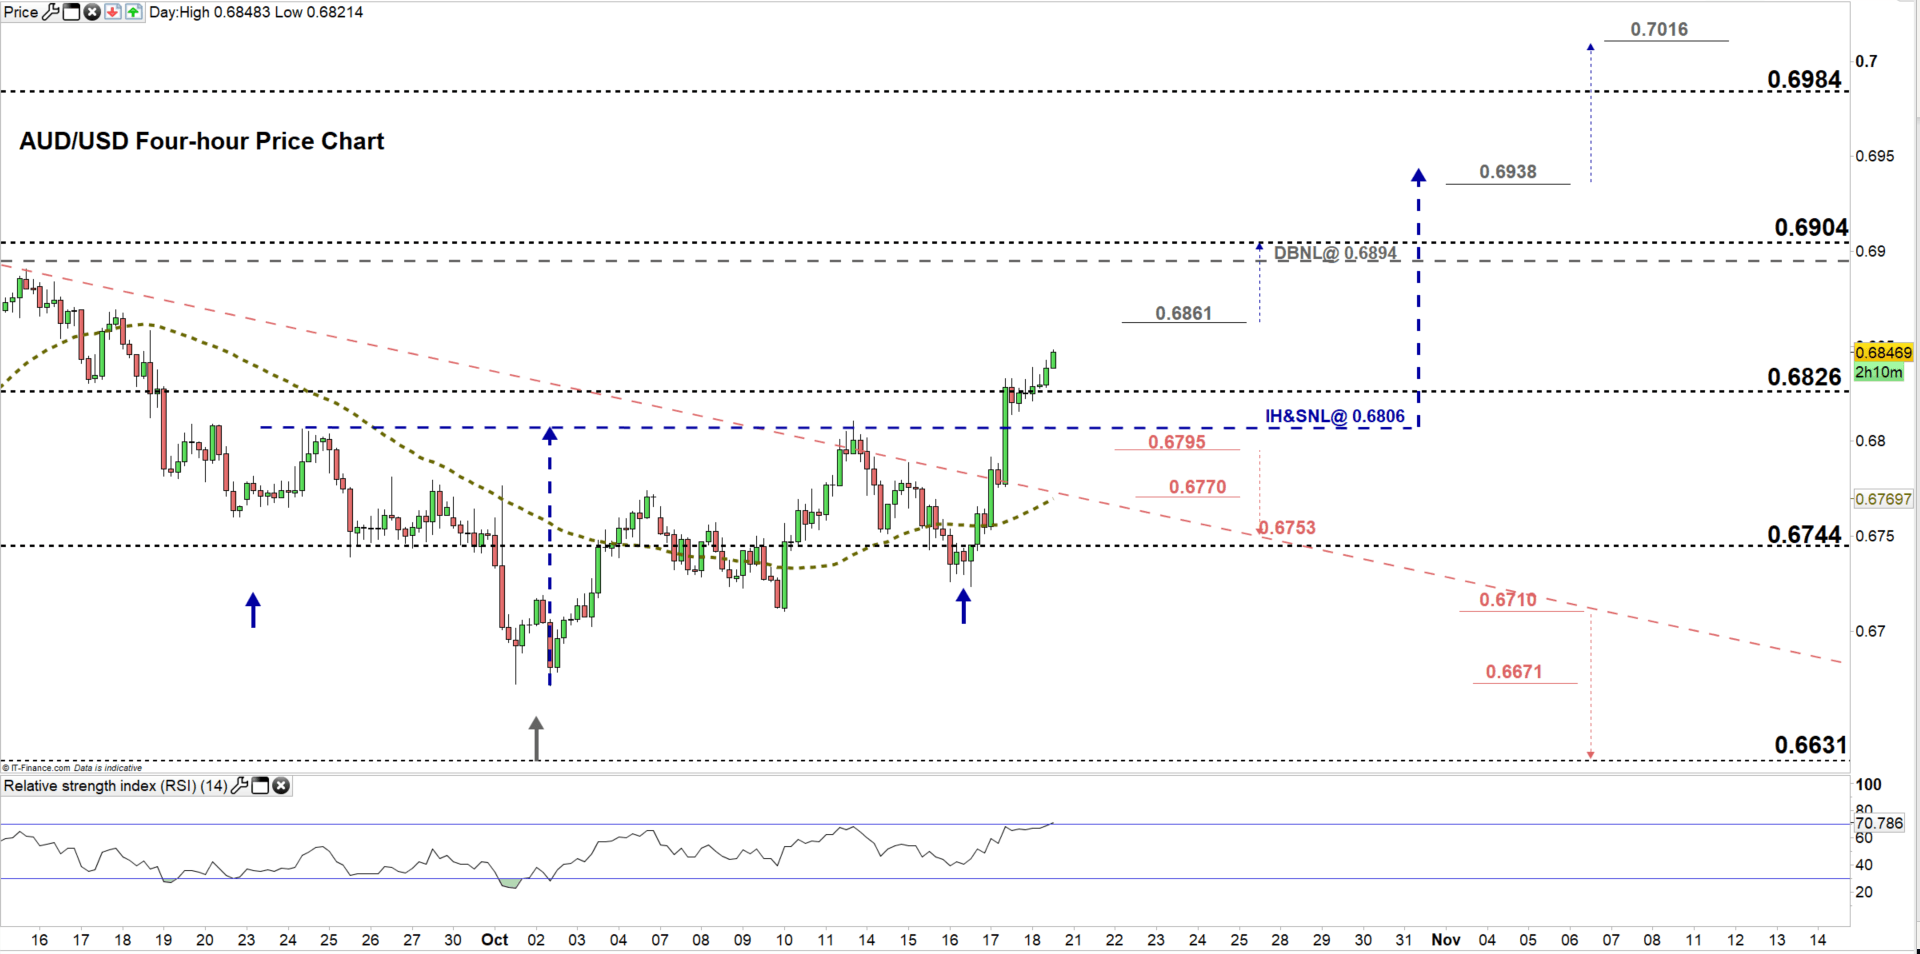
From the four- hour chart, we notice yesterday AUD/USD broke above the neckline of inverted head and shoulders pattern. Thus, if the price remains above 0.6806 this could mean more bullishness towards 0.6938.
Its worth mentioning, a break above 0.6861 could lead AUDUSD towards the high end of the trading zone discussed above on the daily chart. Although, the neckline of double bottom pattern marked on the chart should be considered.
On the flip-side, if the price declines below the neckline of the inverted head and shoulders, then a break below 0.6795 may press AUDUSD towards 0.6753. However, the daily support underlined on the chart should be monitored.
See the chart to know more about key levels to monitor in a further bullish/bearish move.
Written By: Mahmoud Alkudsi
Please feel free to contact me on Twitter: @Malkudsi


