


Daily
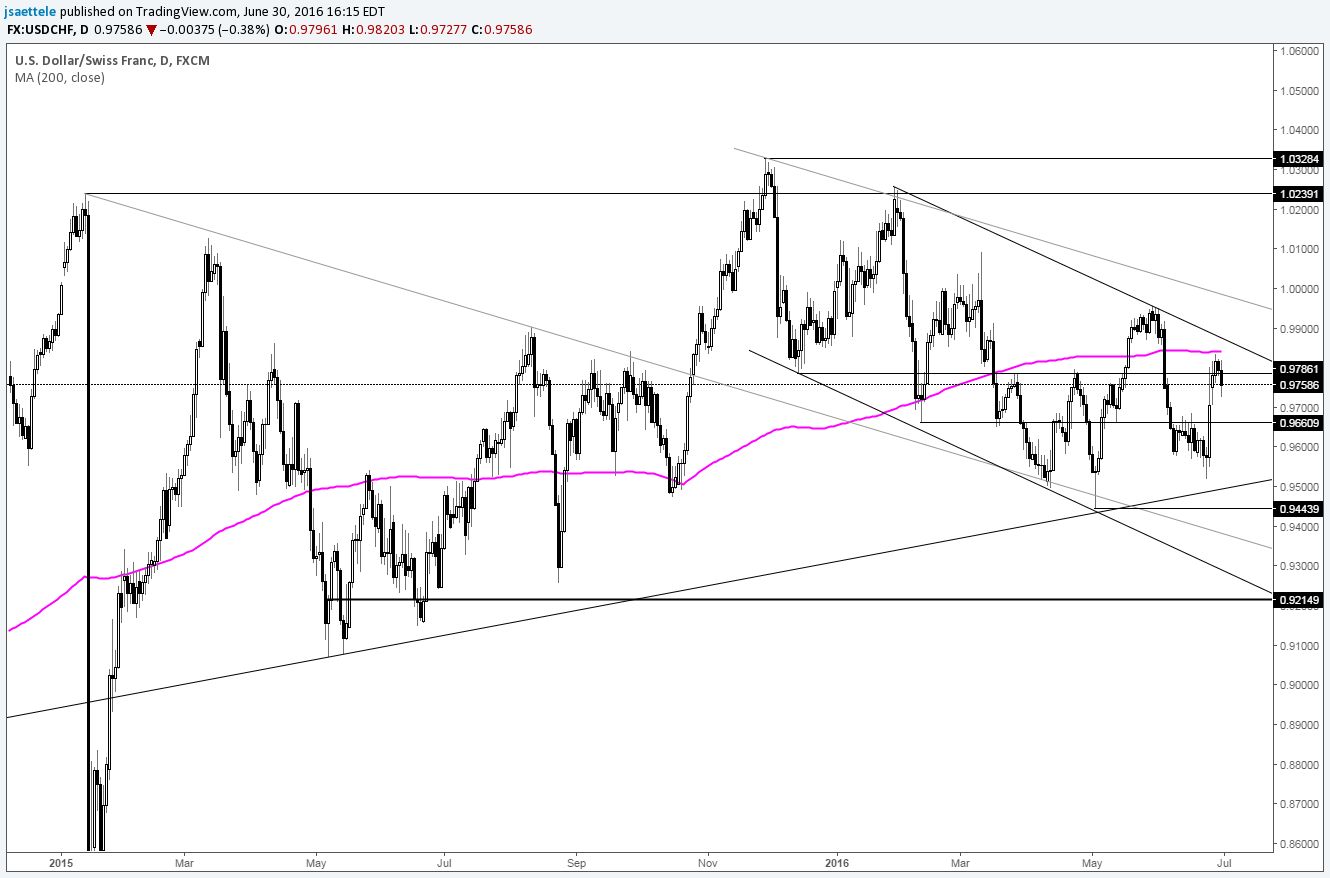
Chart Prepared by Jamie Saettele, CMT
DailyFX Trading Guides and Forecasts
-Recent updates noted that “USD/CHF broke through the wedge so the ‘major advance’ may be underway.” The break through former wedge resistance signals a failed bullish pattern. Failed bullish patterns are viewed in a bearish context. Given this long term chart, USD/CHF is in trouble on a break below .9440. Near term, watch for resistance near the 200 day average and line off of the January and May highs.
For more analysis and trade setups (exact entry and exit), visit SB Trade Desk


