USD/CAD Highlights:
- USD/CAD sitting on 2017 trend-line and holding so far
- Stuck in a firm downward trend with trend-line resistance
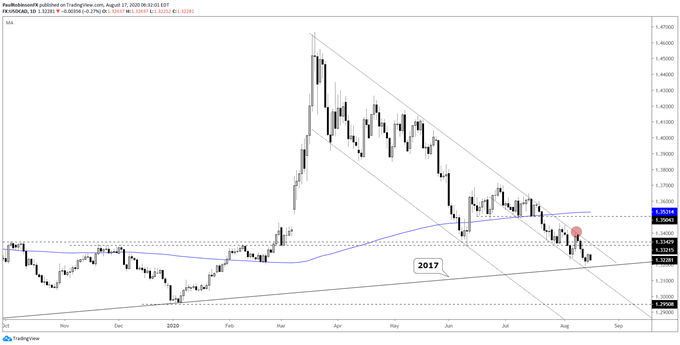
USD/CAD is trading on a trend-line dating back to September 2017; it crosses under the 2018 and 2019 lows (created on NYE). Since these are all yearly lows it gives the trend-line extra importance, but can USD/CAD lift off it and turn the March-present downtrend around?
For starters, support is support until it isn’t. So while the downtrend suggests price could keep sinking, we must still respect trend support for now. This means fresh short positions may be best served waiting for a break, while fresh longs looking for a broader reversal higher have a solid line-in-the-sand from which to assess risk.
Looking at the trend off the March spike-high, there is a nice set of parallels in play, and if you take the parallel of those lines you can make the underside line of a channel that has been developing since the early days of July. This channel is a solid good guide to continue to watch.
If USD/CAD is to hold onto the 2017 trend-line and reverse course, then it will need to get out of the confines of the channel. A break above the upper parallel of the structure will also constitute a breaking of the trend-line from March. That would only be the beginning of a reversal as trend-line/channel breaks in of themselves don’t necessarily signal a trend change, only provide the first sign one could be underway.
We would also want to see how momentum is in such a scenario, the stronger the better. And to really see if the break is for real it is ideal that only a shallow pullback develops after the initial thrust across the downtrend line. But we will cross that bridge should we get there…
For now, to reiterate – support should be respected until broken. But if it does break, then watch for the NYE 2019 low at 12951 to be the next targeted objective. If support holds, then watch to see if trend resistance can be broken with force.


USD/CAD Daily Chart (2017 trend-line vs channel)

Resources for Forex & CFD Traders
Whether you are a new or experienced trader, we have several resources available to help you; indicator for tracking trader sentiment, quarterly trading forecasts, analytical and educational webinars held daily, trading guides to help you improve trading performance, and one specifically for those who are new to forex.
---Written by Paul Robinson, Market Analyst
You can follow Paul on Twitter at @PaulRobinsonFX


