


Since May 8, we have been anticipating a top in place for USD/CAD that may drive the pair towards 1.24. We have not reached 1.24 yet and on Wednesday, Bank of Canada releases their latest round of monetary policy with the expectation of a rate hike. The consensus is for a 25 basis point hike so the weakness in USD/CAD is likely baked into the rate already. (Join David Song here for live coverage and analysis of the rate announcement.)
The longer term Elliott Wave model we are following suggests the downtrend still has room to run. However, the near term trend is becoming exhausted and the possibility of a bounce higher is elevated.
The image below is the longer term model and suggests the pair is correcting lower in (A)-(B)-(C) fashion. Typically, wave (C) has an equal or Fibonacci relationship to wave (A). The first such wave relationship arrives near 1.24 which is also where an upward sloping trend line rests. Therefore, we are anticipating a battle to be fought near 1.24.

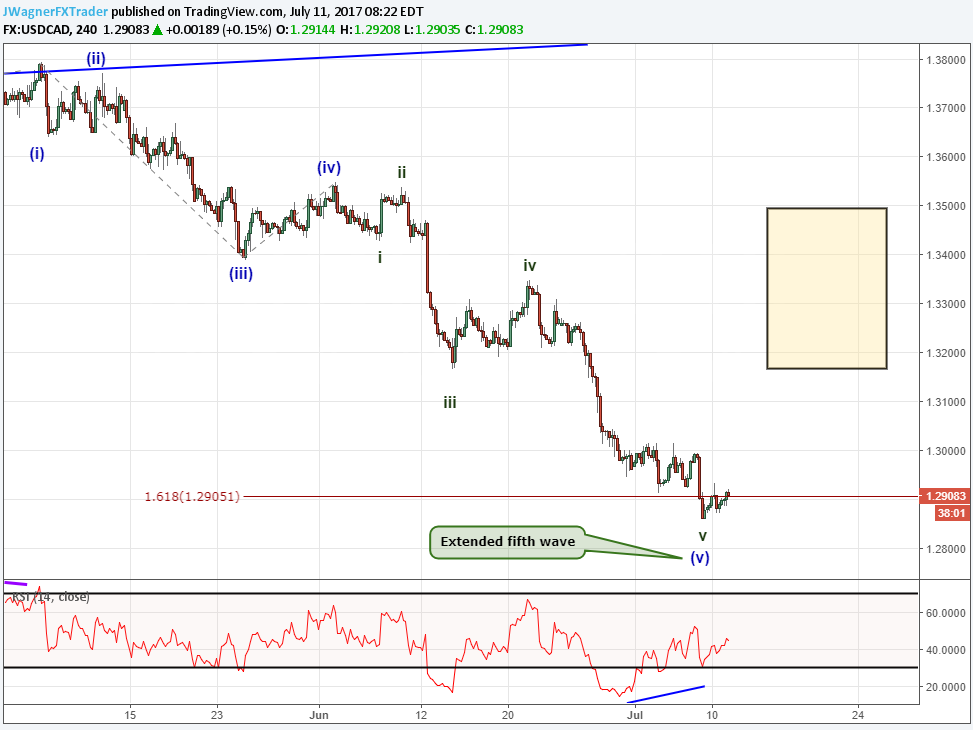
Zooming in to an intraday chart, the shorter term Elliott Wave model suggests the current downtrend is maturing and is ripe for a bounce. As labeled, the model shows a completed impulse wave that implies the pair may move into corrective mode higher.
First, it appears wave (v) was an extended wave as it currently rests near 1.618 the length of waves (i) through (iii). Secondly, we can see evidence of RSI divergence that is consistent with the current positioning in the wave count.
Sentiment paints a picture of a possible correction as well. The number of net bearish traders has increased 17% over yesterday and increased 35% over last week. We want to use that as a contrarian signal, which suggests a bounce higher may be on the horizon. Learn how to trade with sentiment with our IG client sentiment guide.
If a bounce begins, a typical and common retracement level may drive up towards 1.32-1.35. Keep in mind, though we are anticipating a bounce, the trend remains down. We encourage traders not to fight the trend, as it is like swimming upstream. The 1.32-1.35 area if reached, may offer traders an opportunity to position to the short side.
Interested in learning more about Elliott Wave Theory? I will be conducting a live webinar on impulse waves later today. (Free registration)
If you prefer hard copy resources, grab the beginner and advanced Elliott Wave guides.
---Written by Jeremy Wagner, CEWA-M
Discuss this market with Jeremy in Monday’s US Opening Bell webinar.
Follow on twitter @JWagnerFXTrader .
Join Jeremy’s distribution list.


