


New Zealand Dollar, NZD/USD, IG Client Sentiment Report – Talking Points:
- The New Zealand Dollar appears poised to extend its climb from the March nadir as price clears key long-term downtrend resistance.
- NZD/USD poised to move higher as price surges back above the trend-defining 50-day moving average.
As noted in previous reports, the New Zealand Dollar’s 24% surge from the lows of March may prove to be the start of a prolonged period of strength against its US Dollar counterpart, as the break above long-term trend resistance hints a cyclical upturn is afoot.
NZD/USD Monthly Chart – Trend Break May Trigger Cyclical Shift

NZD/USD daily chart created using TradingView
The chart above highlights the cyclical nature seen in NZD/USD rates over the past 26 years, with the currency pair largely adhering to what appears to be an 8-year rotation. It has set significant bottoms in late 2000, early 2009 and mid-2015.
Bullish RSI divergence in late 2000 seemed to signal the end of the New Zealand Dollar’s five-year decline from the November 1996 high (0.7147) and triggered a shift in overall market sentiment, as price surged over 110% to eventually peak in February 2009 (0.8214).
In fact, recent price action looks strikingly similar to that seen early in the bullish cycle ignited in October 2000 and could be indicative of further upside for NZD/USD, if price remains constructively positioned above the downtrend extending from the 2014 high and key support at the 23.6% Fibonacci (0.6484).
Therefore, the risk-sensitive currency appears poised to significantly extend its 24% surge from the March nadir, with cycle analysis suggesting NZD/USD rates may rise as much as 50% from current levels to eventually peak in mid-2026.
Of course, this is hardly a given when taking into account the uncertain global economic outlook and the ultra-dovish stance of the Reserve Bank of New Zealand.
Nevertheless, traders should continue to monitor long-term developments, as a monthly close above the September high (0.6798) could generate an extended topside push towards the 2017 high (0.7558).
NZD/USD Daily Chart – Psychological Resistance Stymying Buying Pressure

NZD/USD daily chart created using TradingView
Jumping into a daily chart reinforces the bullish outlook depicted on the monthly timeframe, as price continues to track above all four moving averages and eyes a push to test the yearly high (0.6798).
The development of the RSI and MACD indicator are indicative of swelling bullish momentum and may ultimately trigger a resumption of the primary uptrend, if NZD/USD can overcome psychological resistance at the 0.6700 mark.
With that in mind, further gains appear in the offing if support at the trend-defining 50-DMA (0.6623) remains intact, with a break above the yearly open (0.6733) bringing key resistance at the September high (0.6798) into focus.
Conversely, a daily close below the 50-DMA would probably precipitate a pullback towards confluent support at the 100-DMA (0.6564), with a break below the 0.6500 mark probably carving a path to test the June 22 low (0.6383).
IG Client Sentiment Report
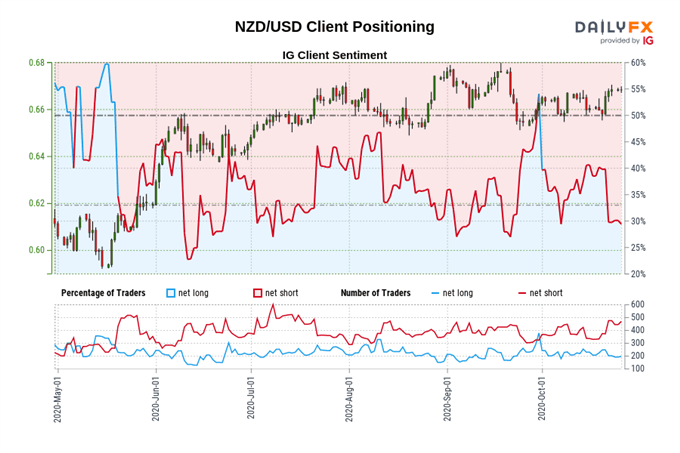
Retail trader data shows 25.99% of traders are net-long with the ratio of traders short to long at 2.85 to 1. The number of traders net-long is 11.05% higher than yesterday and 7.86% lower from last week, while the number of traders net-short is 35.97% higher than yesterday and 54.50% higher from last week.
We typically take a contrarian view to crowd sentiment, and the fact traders are net-short suggests NZD/USD prices may continue to rise.
Traders are further net-short than yesterday and last week, and the combination of current sentiment and recent changes gives us a stronger NZD/USD-bullish contrarian trading bias.
-- Written by Daniel Moss, Analyst for DailyFX
Follow me on Twitter @DanielGMoss


