


New Zealand Dollar Price Outlook, NZD/USD, NZD/JPY, NZD Technical Analysis – Talking Points:
- The New Zealand Dollar seems poised to extend its relentless surge from the lows of March as price clears key downtrend.
- NZD/USD eyeing December 2019 high after confirming break of key resistance.
- NZD/JPY looks to be carving out bullish continuation pattern just shy of the July high
The New Zealand Dollar’s 23% surge from the lows of March may prove to be the start of a prolonged period of strength against its US Dollar counterpart, as the break above the 2014 downtrend hints at extension of its four-month uptrend.
New Zealand Dollar Monthly Chart – Start of a Cyclical Upturn?

NZD/USD monthly chart created using TradingView
The NZD/USD exchange rate’s 5-year decline from the July 2014 high (0.8836), to the bottom set in March (0.5469) this year, exhibits a striking similarity to the risk-sensitive currency’s fall from the November 1996 high (0.7176).
This may be indicative of a cyclical upturn, as the break of 5-year trend resistance in May 2002 seemingly initiated a shift in market sentiment and resulted in a 110% surge to peak at the record high in early-2008.
Furthermore, the development of the RSI may have signalled the end of the bearish rotation extending from the 2014 highs, replicating the bullish divergence seen on the oscillator as price set key bottoms in October 2000 (0.3901) and March 2009 (0.4891).
With that in mind, the New Zealand Dollar may be poised to rise against its haven-associated counterparts, with a monthly close above the sentiment-defining 2014 downtrend potentially initiating a 5-year bullish rotation in NZD/USD rates.

NZD/USD Daily Chart – Support at June High Directing Price Higher

NZD/USD daily chart created using TradingView
Zooming into a daily timeframe seems to confirm the bullish tilt seen on higher time-frames, as price continues to track the uptrend from the March low (0.5469) and bounces off key support at the June high (0.6585).
Moreover, bearish divergence between price and the RSI failed to encourage a more sustained pullback, hinting that a push to the December 2019 high (0.6756) could likely eventuate in the coming days.
The 50-day moving average (0.6502) also suggests an extension of the recent uptrend as it crosses above its sentiment-defining 200-period counterpart (0.6390).
A daily close above the July high (0.6716) is needed to validate bullish potential and could carve a path to test the psychologically imposing 0.68 level for the first time since April 2019.
However, buyers will first have to overcome resistance at the December 2019 high (0.6756).
| Change in | Longs | Shorts | OI |
| Daily | 6% | 1% | 5% |
| Weekly | -7% | 23% | 1% |
NZD/JPY Daily Chart – Carving Out Ascending Triangle Continuation Pattern
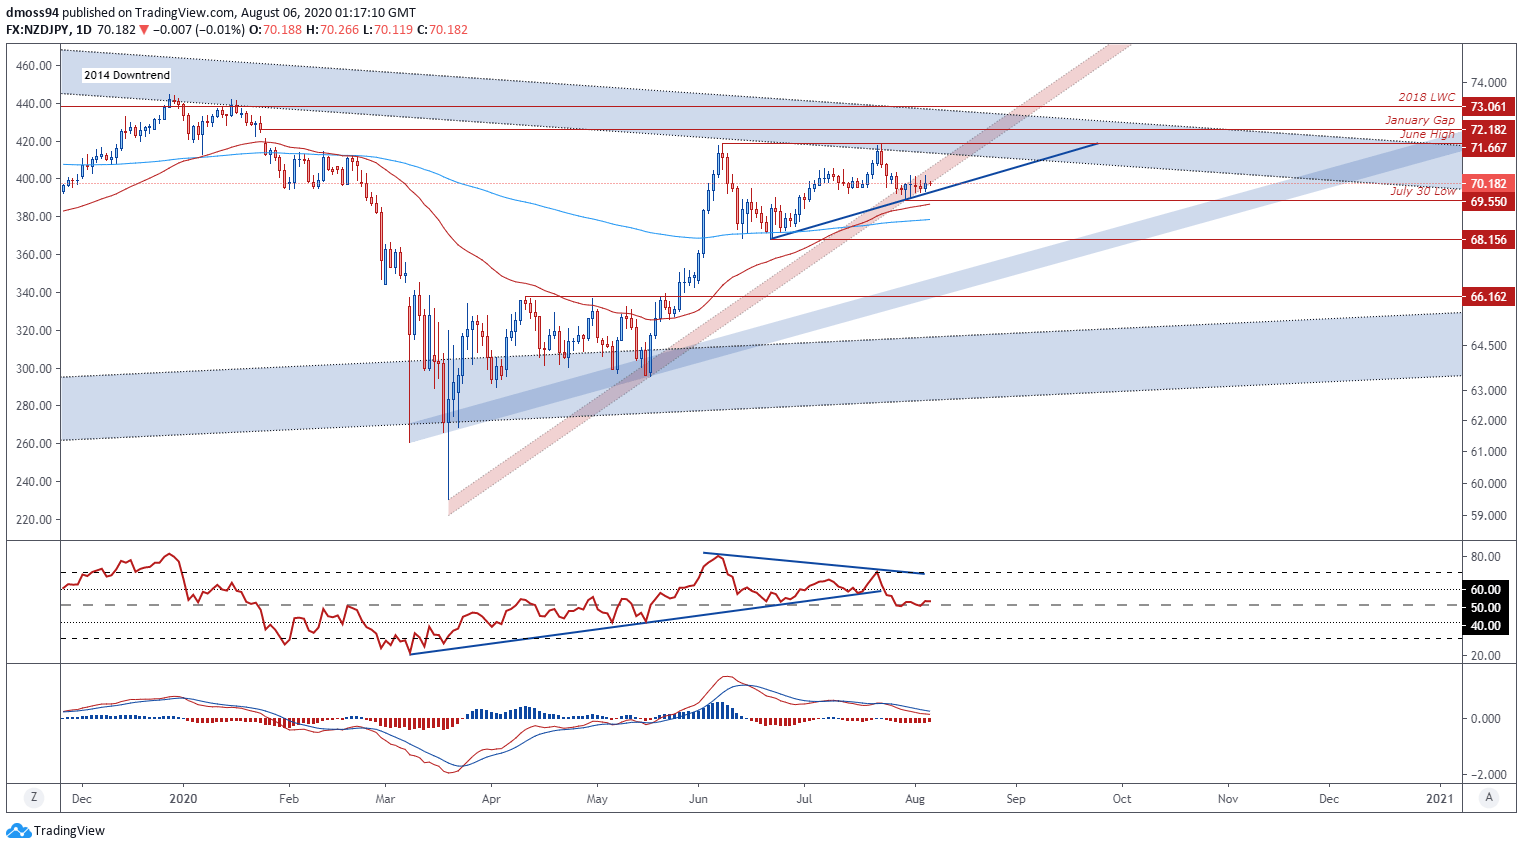
NZD/JPY daily chart created using TradingView
The NZD/JPY exchange rate also looks poised to extend its climb from the lows of March, as price begins to carve out a potential Ascending Triangle continuation pattern at the June high (71.66).
Although the New Zealand Dollar retreated almost 3% from last month’s high (71.67) it has retained its constructive outlook, as the RSI hovers above its neutral midpoint and the MACD eyes a bullish cross to the topside of the ‘slower’ signal line.
Furthermore, the 50-DMA (0.6940) may direct NZD/JPY rates higher, surging above the 200-DMA (0.6886) at the end of last month and providing mobile support just below the August low (0.6985).
Should triangle support remain intact, a climb to retest the July high (0.7167) looks to be in the offing.
On the other hand, a break and close below the July 30 low (0.6955) would probably invalidate bullish potential and may open a path for a sustained decline back to the 200-DMA (0.6886).
-- Written by Daniel Moss, Analyst for DailyFX
Follow me on Twitter @DanielGMoss


