


Dow Jones, S&P 500, Fed, Retail Trader Positioning, Technical Analysis – IGCS Wall Street Update
- Retail traders have been rethinking their bets on Wall Street
- Dow Jones and S&P 500 long exposure has been on the rise
- This is warning that further losses may be in store for stocks

Volatility seems to be seeping its way back into Wall Street as the Dow Jones and S&P 500 set course for their worst week since the middle of June. Some of this could be explained by markets rethinking about a Fed ‘pivot’ in 2023. That is also not the only thing that traders have been rethinking.
Looking at IG Client Sentiment (IGCS), it seems retail traders have been buying into Wall Street’s losses. IGCS tends to function as a contrarian indicator. With that in mind, if positioning continues heading in this direction, could further losses be in store for stock markets?
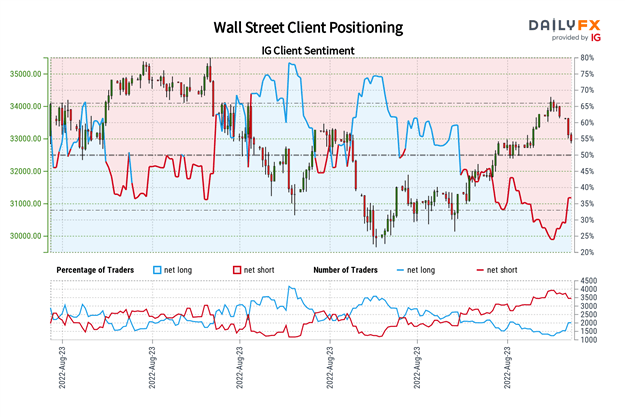
Dow Jones Sentiment Outlook - Bearish
The IGCS gauge shows that about 40% of retail traders are net-long the Dow Jones. Since most investors are still majority short, this seems to hint prices may keep rising. However, upside exposure increased by 8.2% and 60.98% compared to yesterday and last week respectively. Taking this into consideration, it seems recent shifts in sentiment hint that the Dow Jones may soon reverse lower.
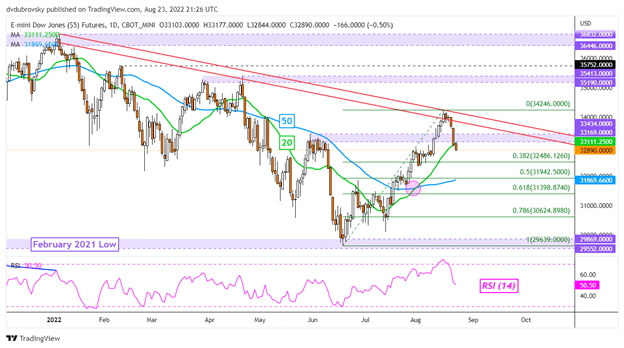
Dow Jones Daily Chart
After Dow Jones futures turned lower on the falling zone of resistance from the beginning of this year, prices confirmed a breakout under the 20-day Simple Moving Average (SMA). This could spell trouble, placing the focus on the 38.2% Fibonacci retracement at 32486 below. Soon after, the 50-day SMA could hold as support. Otherwise, a breakout under the latter may open the door to extending losses.

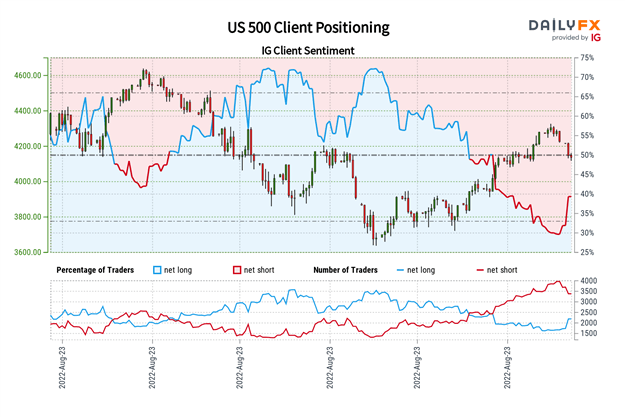
S&P 500 Sentiment Outlook - Bearish
The IGCS gauge shows that about 40% of retail traders are net-long the S&P 500. Since most of them are still biased to the downside, this hints that prices may continue rising. Just like the Dow Jones, here upside exposure has increased by 6.57% and 25.10% compared to yesterday and last week respectively. These changes warn that the S&P 500 could reverse lower ahead.
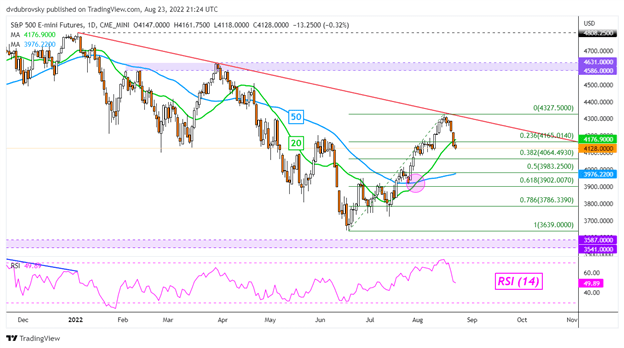
S&P 500 Daily Chart
After S&P 500 futures turned lower on the falling trendline from January, prices subsequently broke under the 20-day SMA. That has opened the door to extending losses, placing the focus on the 38.2% Fibonacci retracement at 4064. Further weakness would place the focus on the 50-day SMA, which may hold. Otherwise, resuming the broader downtrend has the 61.8% retracement level in sight at 3902.

*IG Client Sentiment Charts and Positioning Data Used from August 23rd Report
--- Written by Daniel Dubrovsky, Strategist for DailyFX.com
To contact Daniel, use the comments section below or @ddubrovskyFX on Twitter


