BTC/USD, ETH/USD Technical Outlook:
- BTC rally looks like a recovery before another big leg lower
- ETH has shown a little more momentum, but will likely turn vulnerable soon


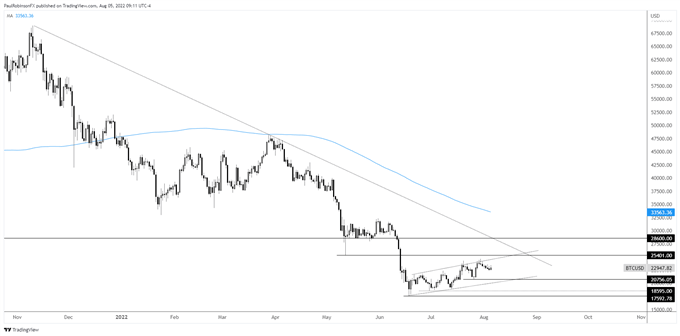
During the recovery in risk assets BTC/USD momentum has been extremely tepid, suggesting that once the bounce in risk comes to an end we will see a strong move lower in BTC and other crypto names. The question is whether we see a sort of last gasp squeeze higher first, or a breaking of a developing bear-flag.
The squeeze higher scenario could be the most interesting from the standpoint that it could be a sudden surge higher that immediately turns once buying dries up. This sort of price sequence isn’t uncommon during corrective patterns.
Under this scenario we may see price as high as 28600/29000 before the turn down begins. Prior to that level 25401 could be problematic as it represents a strong spike-low in May and is now viewed as resistance. In the event we see price continue to meander, then look for the choppy upward price action to get snapped via a lower low beneath whatever the last low is in the sequence.
This would have the bear-flag looking pattern confirmed. The first lower low at this juncture is the July 26 low at 20700, but if we see yesterday’s low hold and another push higher unfolds then it would become the most recent higher low in the bounce off the June low.
First support on weakness clocks in at 20756 and the underside trend-line from June, then 18595 and the June low at 17592.
BTC/USD Daily Chart

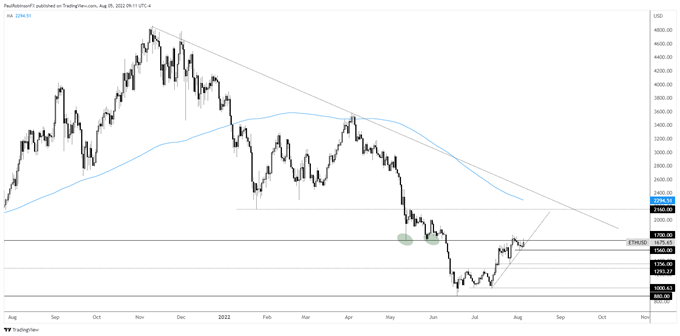
ETH/USD is doing a little better than BTC/USD, but if the crypto space is headed down even further, and I believe this to be the case, then it won’t escape gravity and will succumb to major selling. Right now it is struggling around the 1700-mark, a series of lows dating to last year.
If ETH can gain further traction then we could see a rally to the 200-day moving average and trend-line off the record highs. In that area is the low from early in the year at 2160 which could make for interesting confluence between horizontal level, trend-line, and the 200-day MA.
On the downside 1560, this week’s low, could be a trigger for sellers if broken. From there 1356, 1293 becomes the next level of support followed by 1000 and the June low at 880.
ETH/USD Daily Chart

Resources for Forex Traders
Whether you are a new or experienced trader, we have several resources available to help you; indicator for tracking trader sentiment, quarterly trading forecasts, analytical and educational webinars held daily, trading guides to help you improve trading performance, and one specifically for those who are new to forex.
---Written by Paul Robinson, Market Analyst
You can follow Paul on Twitter at @PaulRobinsonFX


