


Dow Jones, S&P 500, Fed, Retail Trader Positioning, Technical Analysis – IGCS Wall Street Update
- The Federal Reserve offered a boost to Wall Street as markets favor a pivot
- Despite gains in the Dow Jones and S&P 500, retail traders continue selling
- Is this a sign that further gains may come from Wall Street, or will things turn?

Wall Street rallied up a storm despite the Federal Reserve hiking rates by 75-basis points. It seems that Chair Jerome Powell’s pivot away from a focus on forward guidance seemed to do the trick. The central bank is looking to a meeting-by-meeting basis for incoming tightening, focusing on the data. In that regard, rising fears about a recession are boosting speculation of a Fed pivot next year.
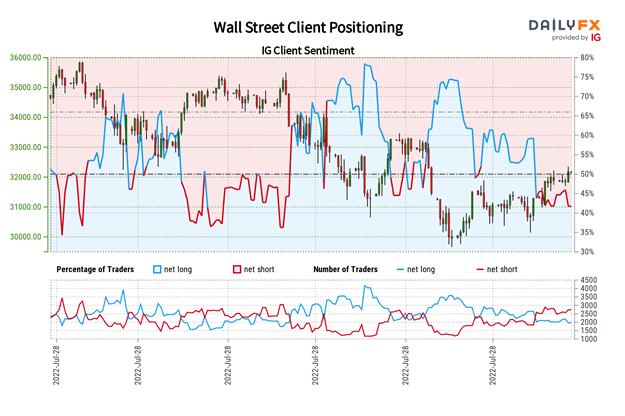
Despite the rise in the Dow Jones and S&P 500, retail traders are increasingly selling into recent price gains. This can be observed by looking at IG Client Sentiment (IGCS), which tends to function as a contrarian indicator. As such, if traders continue to sell the stock market, the indicator could hint at further gains to come from Wall Street.
Dow Jones Sentiment Outlook - Bullish
The IGCS gauge shows that about 42% of retail traders are net-long the Dow Jones. Long exposure is on the decline, dropping 10.17% and 6.02% compared to yesterday and last week respectively. Since most traders are now short, this seems to suggest further gains may come from the Dow Jones.
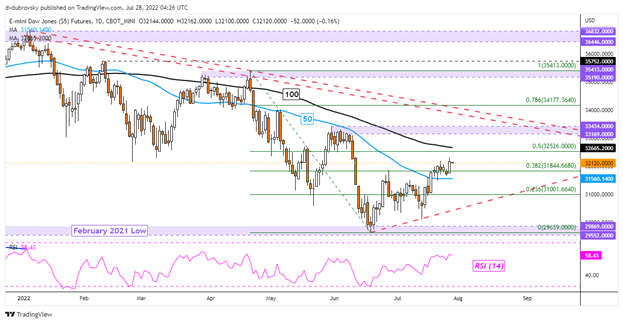
Dow Jones Daily Chart
Dow Jones futures are up over 8 percent since June’s bottom, though the dominant downtrend since the beginning of this year remains intact. Recently, prices confirmed a breakout above the 50-day Simple Moving Average (SMA). That has opened the door to extending gains, placing the focus on the 100-day SMA. Taking out the latter would subsequently expose the 33169 – 33434 resistance zone.

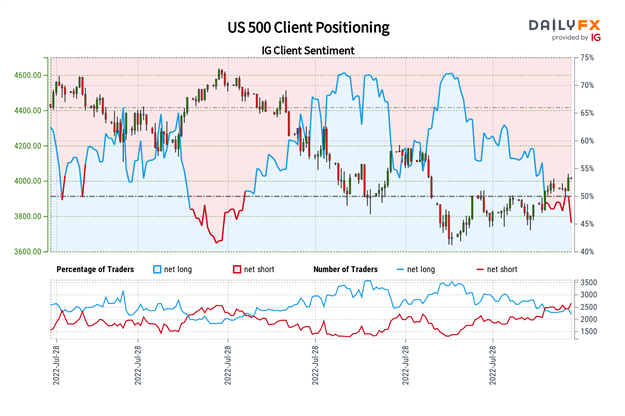
S&P 500 Sentiment Outlook - Bullish
The IGCS gauge shows that roughly 45% of retail traders are net-long the S&P 500. Since most investors are biased to the downside now, this suggests prices may continue rising. Short exposure has increased by 9.05% and 8.47% compared to yesterday and last week respectively. With that in mind, the combination of current sentiment and recent changes are producing a stronger bullish contrarian trading bias.
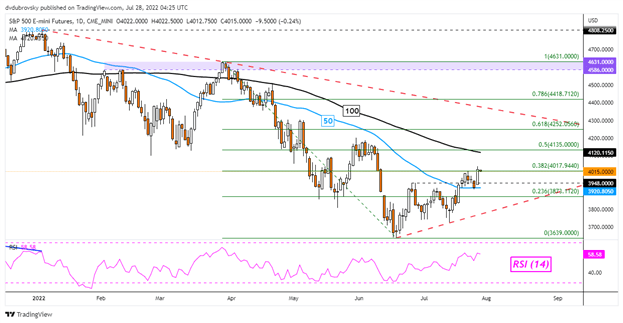
S&P 500 Daily Chart
S&P 500 futures have also confirmed a breakout above the 50-day SMA, pushing higher over 10% since bottoming in June. Immediate resistance seems to be the 38.2% Fibonacci retracement at 4017, with the 100-day SMA above. The latter could hold as resistance, maintaining the broader downside focus. Otherwise, extending gains places the focus on early June highs for resistance down the road.

*IG Client Sentiment Charts and Positioning Data Used from July 27th Report
--- Written by Daniel Dubrovsky, Strategist for DailyFX.com
To contact Daniel, use the comments section below or @ddubrovskyFX on Twitter


