


Japanese Yen Talking Points:
- Yen-weakness has continued to show with USD/JPY hitting a fresh 24-year high last Thursday.
- There’s a Bank of Japan rate decision on Wednesday night/Thursday morning, just hours before the European Central Bank is expected to lift rates for the first time since 2011. There’s little expectation for the BoJ to make any shifts to policy.
- The analysis contained in article relies on price action and chart formations. To learn more about price action or chart patterns, check out our DailyFX Education section.

This week brings a Bank of Japan meeting just hours ahead of the European Central Bank’s rate decision. And while the ECB is expected to lift rates in the effort of starting to fight inflation, there aren’t such expectations around the BoJ. The Bank of Japan is expected to maintain policy while pledging to keep rates at current levels or lower. And with inflation at just 2.1% in the most recent data, there’s not the same level of motivation to tighten policy as what’s being seen elsewhere, such as the US.
But, that glaring divergence has already allowed for a massive move in the USD/JPY pair. And with the FOMC set to continue lifting rates next week, that deviation may have the wherewithal to continue growing in USD/JPY. At this point, resistance has played-in on USD/JPY just ahead of a test of the 140.00 psychological level, which hasn’t been traded at since August of 1998.
USD/JPY Monthly Chart
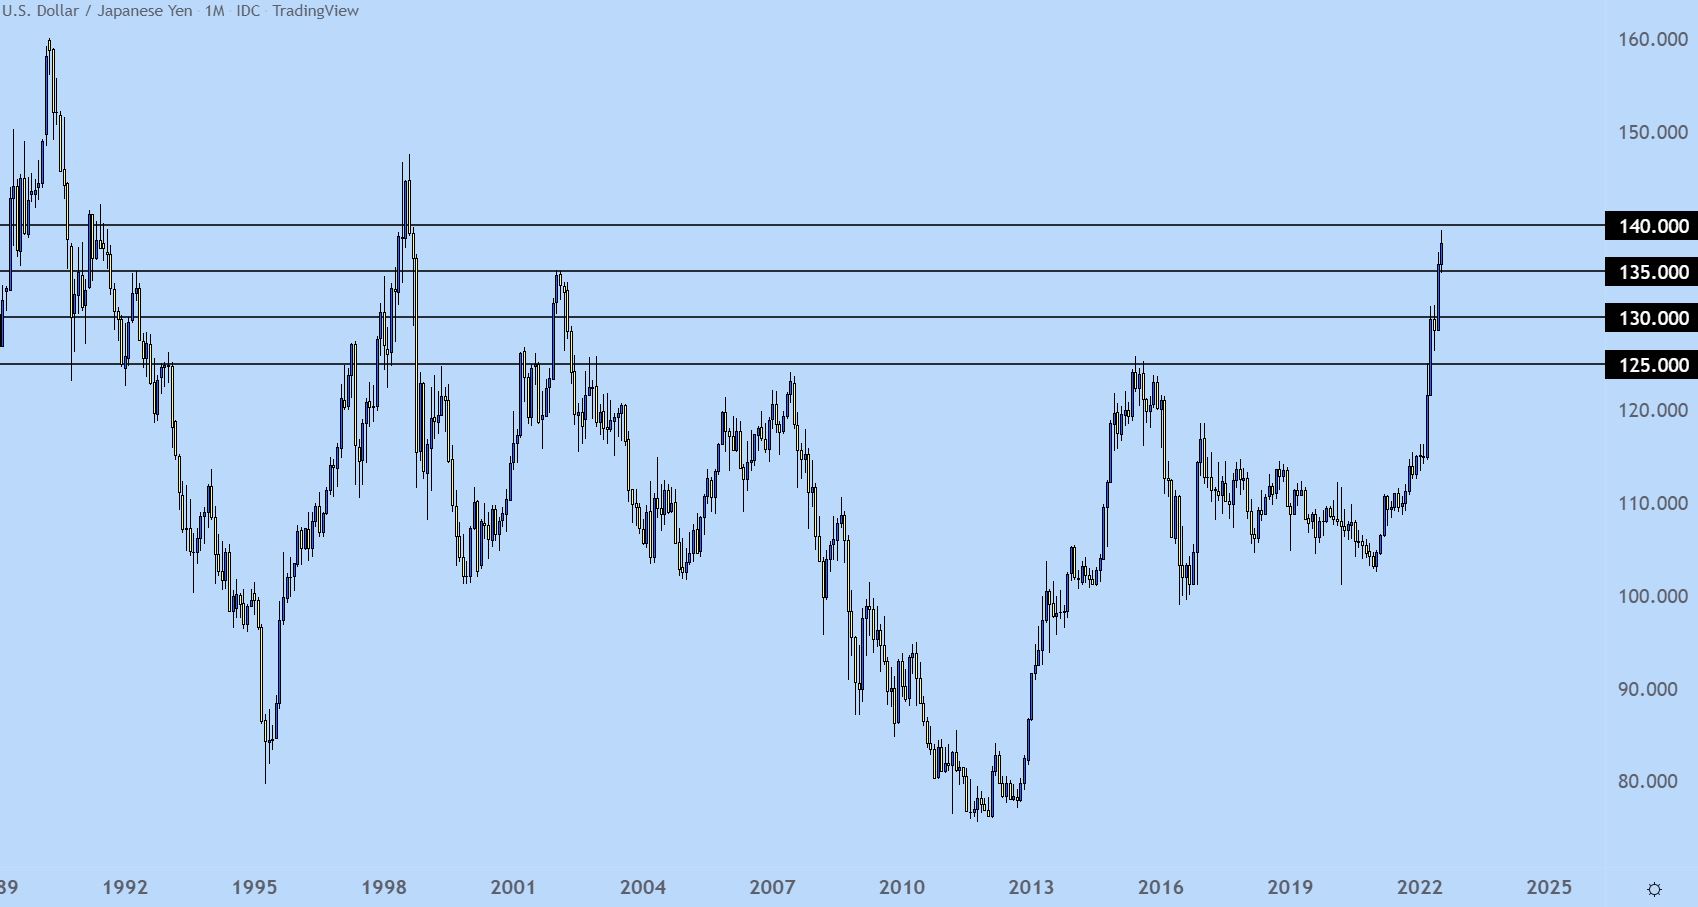
Chart prepared by James Stanley; USD/JPY on Tradingview
Going shorter-term, we can really see that bullish move heating up in USD/JPY since March. The pair came into the month of March at the 115.00 handle which, at the time, was impressive as this was near five-year-highs.
What’s happened over the past four months, however, is darn near parabolic. There’s a hastening of this theme that’s been getting priced-in and notice how each progressive psychological level identified, save for the 120 level, elicited a pause in the move-higher. And this could be an element of a market making new significant moves; with a dearth of historical data available traders are shying away as price approaches the next major psychological level, such as we saw around 130 or 135, only for prices to pullback before the trend-side move continues.
USD/JPY Weekly Price Chart
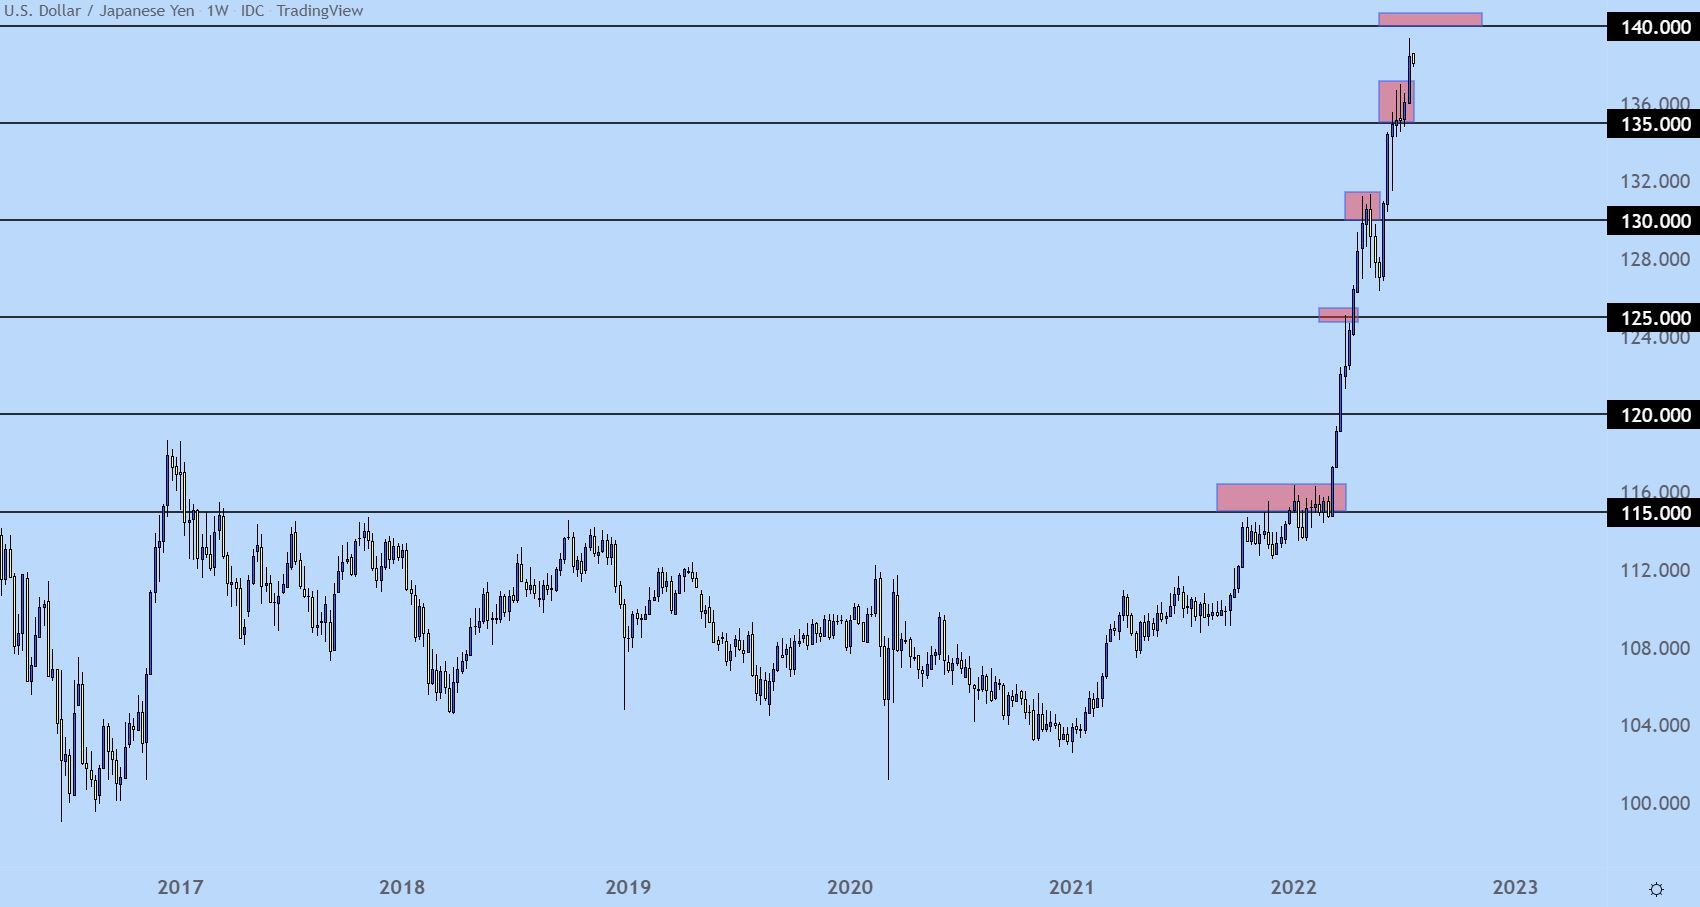
Chart prepared by James Stanley; USD/JPY on Tradingview
USD/JPY Shorter-Term
At this point, there remains support potential around the 135.00 handle. There’s also a shorter-term spot taken from prior resistance, plotted from 136.45-137.00 that remains of interest for those looking to treat the trend a bit more aggressively.
USD/JPY Four-Hour Chart
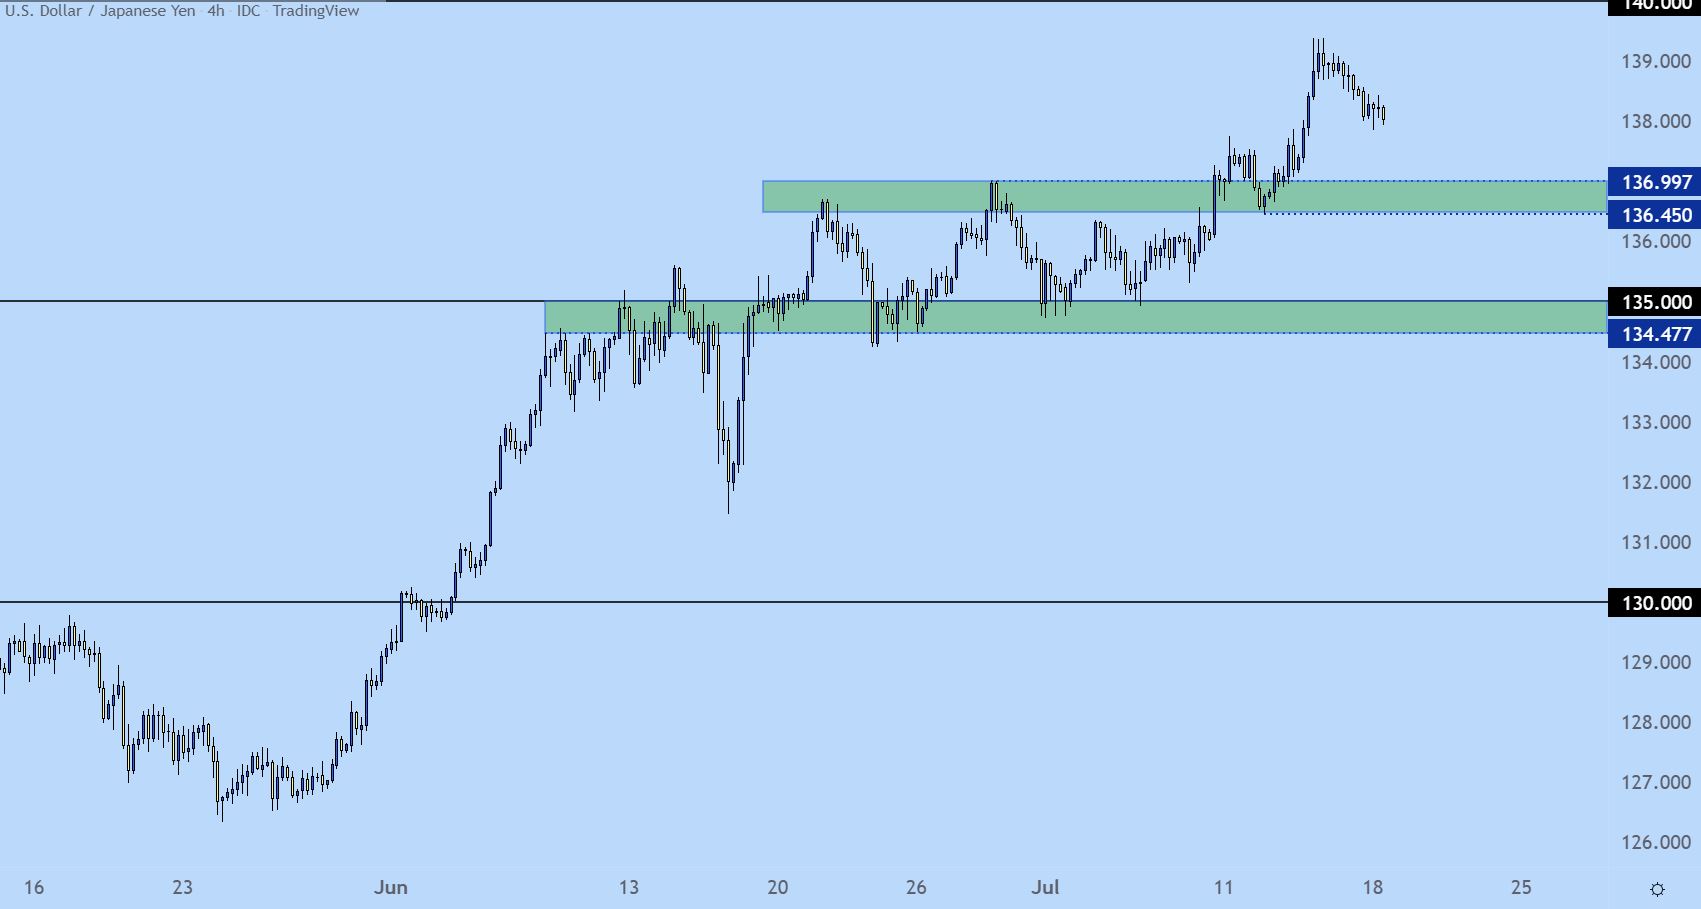
Chart prepared by James Stanley; USD/JPY on Tradingview
EUR/JPY – Resistance at Prior Support
In EUR/JPY, the pair is climbing after giving tones of breakdown earlier in the month of July. Prices fell through the bottom of a rising wedge, which is often followed with the aim of bearish reversals. Prices have since pulled back, but are now finding resistance from a prior support trendline, while also testing above the 140.00 psychological level.
EUR/JPY Daily Price Chart
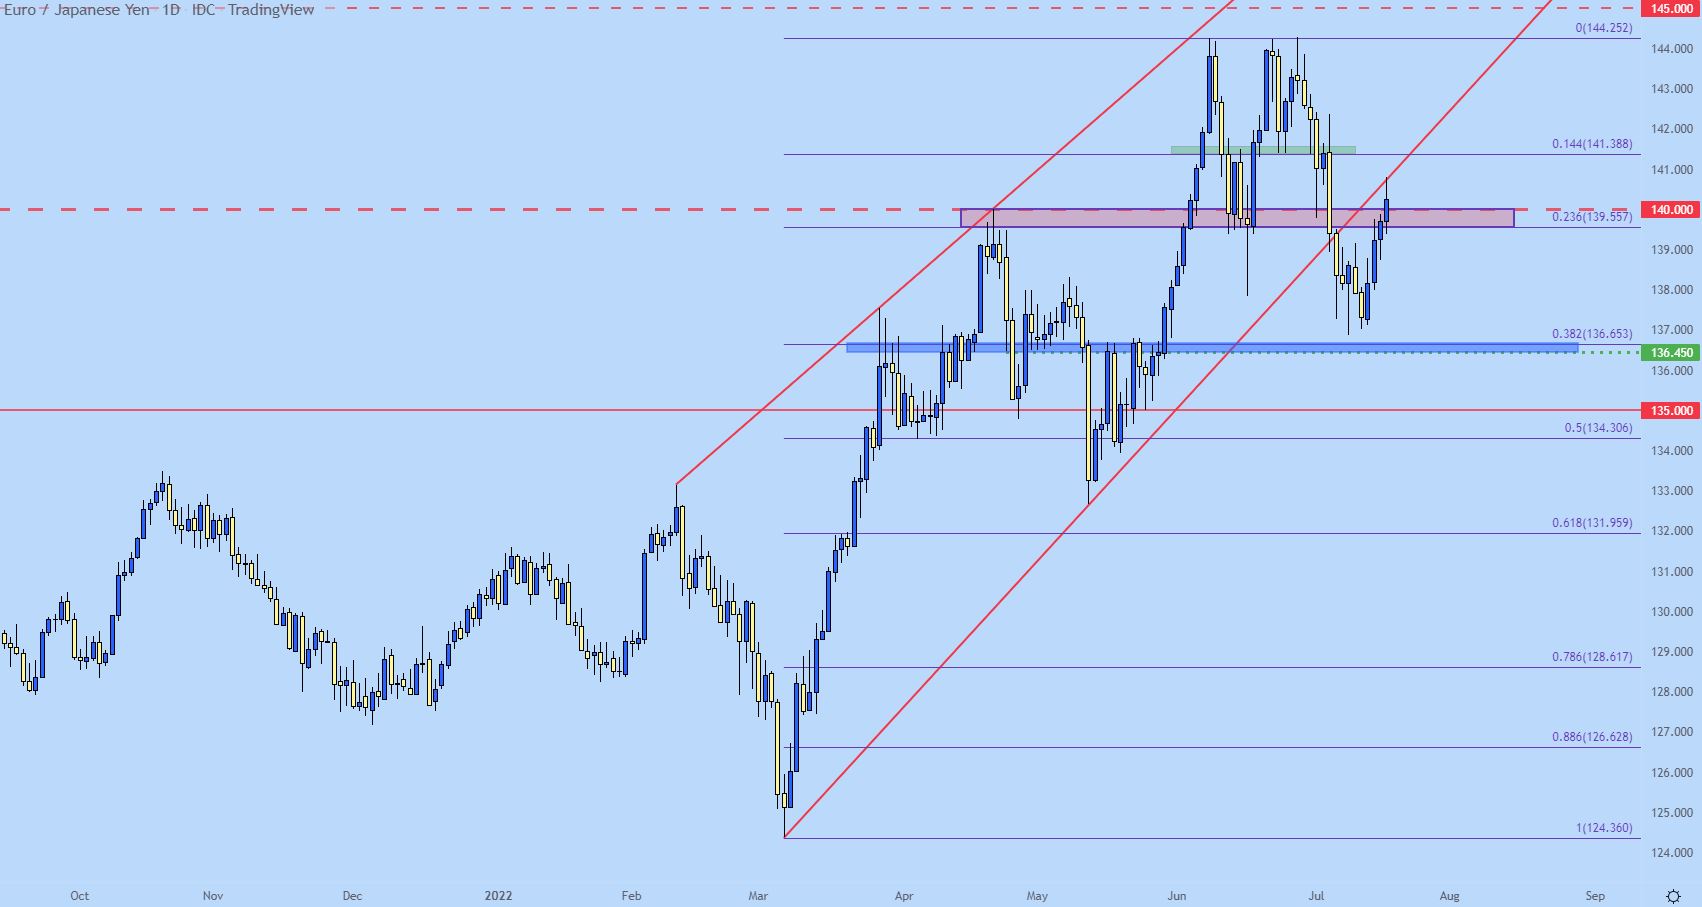
Chart prepared by James Stanley; EUR/JPY on Tradingview
EUR/JPY Shorter-Term
Now that the resistance reaction is playing-in off of the trendline projection, the big question is whether sellers can respond. Going down to the four-hour chart shows a key waypoint along the way: There’s a support zone that runs from 139.56-140.00, and a breach-below that re-opens the door for sellers.
EUR/JPY Four-Hour Chart

Chart prepared by James Stanley; EUR/JPY on Tradingview
GBP/JPY
GBP/JPY remains of interest. Longer-term, there’s a double top in here after price twice failed to break-through Fibonacci resistance at 168.06. And if that formation fills in, there could be a massive move to follow as there’s more than 1200 pips from the neckline to the top of that formation.
Shorter-term, however, there’s a bearish trendline emanating from that second failed break that’s currently helping to hold today’s high.
GBP/JPY Daily Chart

Chart prepared by James Stanley; GBP/JPY on Tradingview
Similar to EUR/JPY above, there’s a major psychological level sitting just underneath price action. In GBP/JPY, that level is 165 and it’s already very nearby current price, but a breach below that opens the door for a deeper bearish move. The 160.00 psychological level is currently helping to mark the monthly low.
GBP/JPY Four-Hour Price Chart
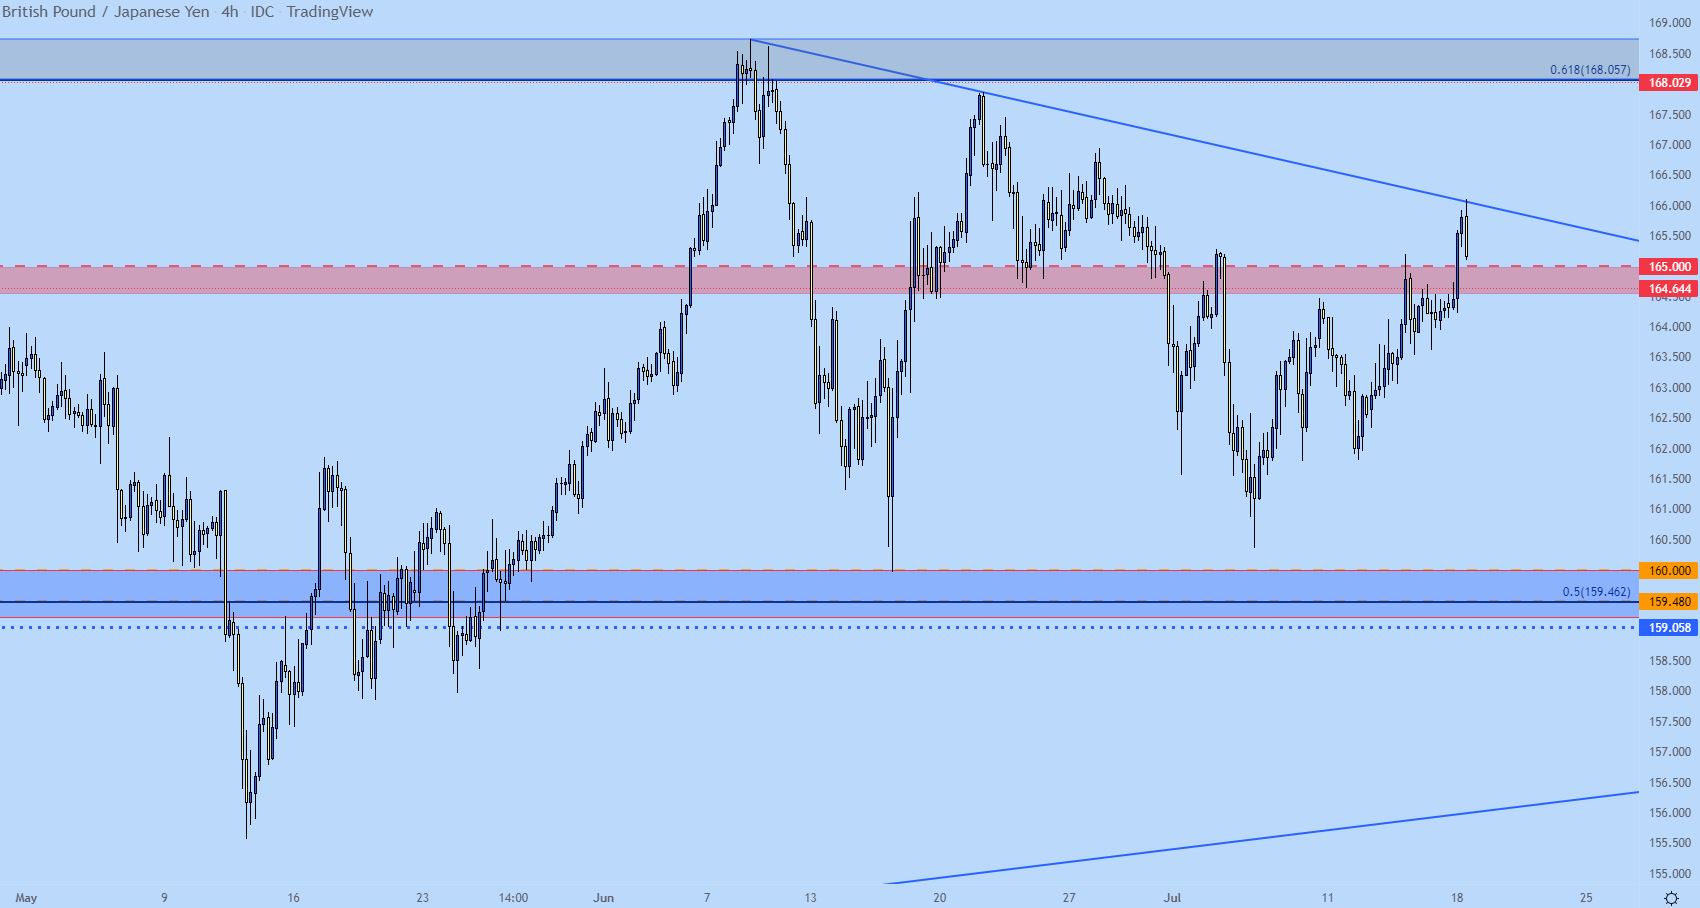
Chart prepared by James Stanley; GBP/JPY on Tradingview
CAD/JPY Pennant Resolution
CAD/JPY is battling around the 14-year-high, which was set in early-June but, to this date, buyers haven’t been able to add an exclamation point to the matter. That fresh high led to a pullback, which took on the form of a bull pennant. That’s actually similar to a longer-term formation that had built last year that resolved in a very bullish way. But – if we do see the BoJ hold policy, the topside of CAD/JPY could be very interesting after the Bank of Canada’s rate hike last week.
CAD/JPY Daily Price Chart
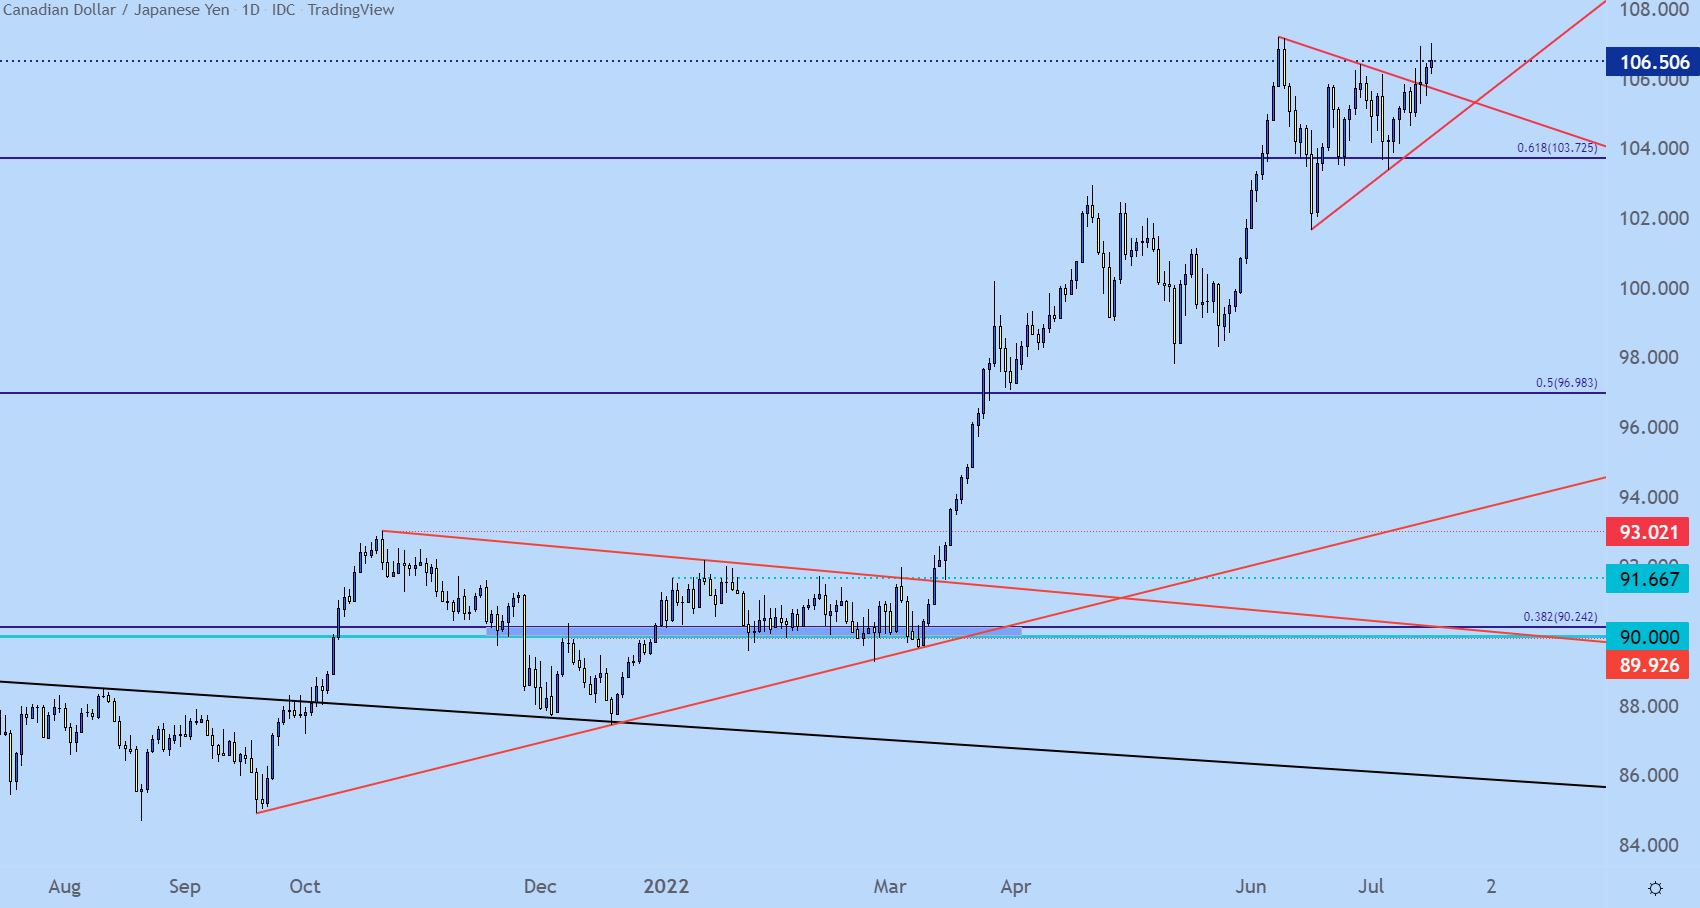
Chart prepared by James Stanley; CAD/JPY on Tradingview
--- Written by James Stanley, Senior Strategist for DailyFX.com
Contact and follow James on Twitter: @JStanleyFX


