


Japanese Yen, USD/JPY, US Dollar, Momentum - Talking Points
- USD/JPY has a top side test of the range in its scopes
- JPY direction against the US Dollar may signal broader moves
- The pause in Yen weakening might over, will USD/JPY go higher?
Introduction to Technical Analysis
Learn Technical Analysis
Recommended by Daniel McCarthy
USD/JPY
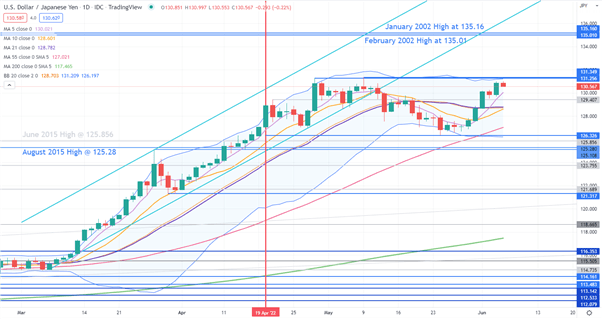
USD/JPY has been in a range of 126.36 – 131.35 for 7 weeks, since 19th April. The top end of that range is a 20-year peak, and the price looks set to challenge that level in the coming days.
A breach of that high could see a resumption of broad Yen weakness emerge. This could see the ascending trend pick-up again.
Interestingly, the 19th April was the day that JPY was at its historical lowest ebb against the CNY. The CNY then devalued rapidly against the US Dollar and consequently more broadly.
Coincidentally, that range also lines up with the upper and lower 21-day simple moving average (SMA) based Bollinger Band s. This could add to the potential of a break of this range instigating a larger move for USD/JPY.
As it moves toward the top end of the range, bullish momentum appears be re-accelerating with the price now above all short, medium and long-term SMAs.

A bullish triple moving average (TMA) formation requires the price to be above the short term SMA, the latter to be above the medium term SMA and the medium term SMA to be above the long term SMA. All SMAs also need to have a positive gradient.
All gradients across the different time periods are positive and looking at the 10-, 55- and 200-day SMAs, the criteria for a TMA have been met.
Although, looking closely at the 21-day SMA, its gradient is only just positive, and it currently lies above the 10-day SMA. If the price continues to trade higher, the 10-day SMA could cross above the 21-day SMA to from a Golden Cross.
On the topside, the recent highs of 131.26 and 131.35 could offer an area of resistance. A break above those 20-year peaks may see a possible test of the resistance zone at the January and February 2002 highs of 135.01 – 135.16.
A move below 126.36 may see a test of support at the break points of 125.28 and 125.11 ahead of the March low of 121.32.
--- Written by Daniel McCarthy, Strategist for DailyFX.com
To contact Daniel, use the comments section below or @DanMcCathyFX on Twitter


