


BTC/USD Technical Outlook:
- Trading around big support under 30k
- The longer it trades here the more bearish it looks

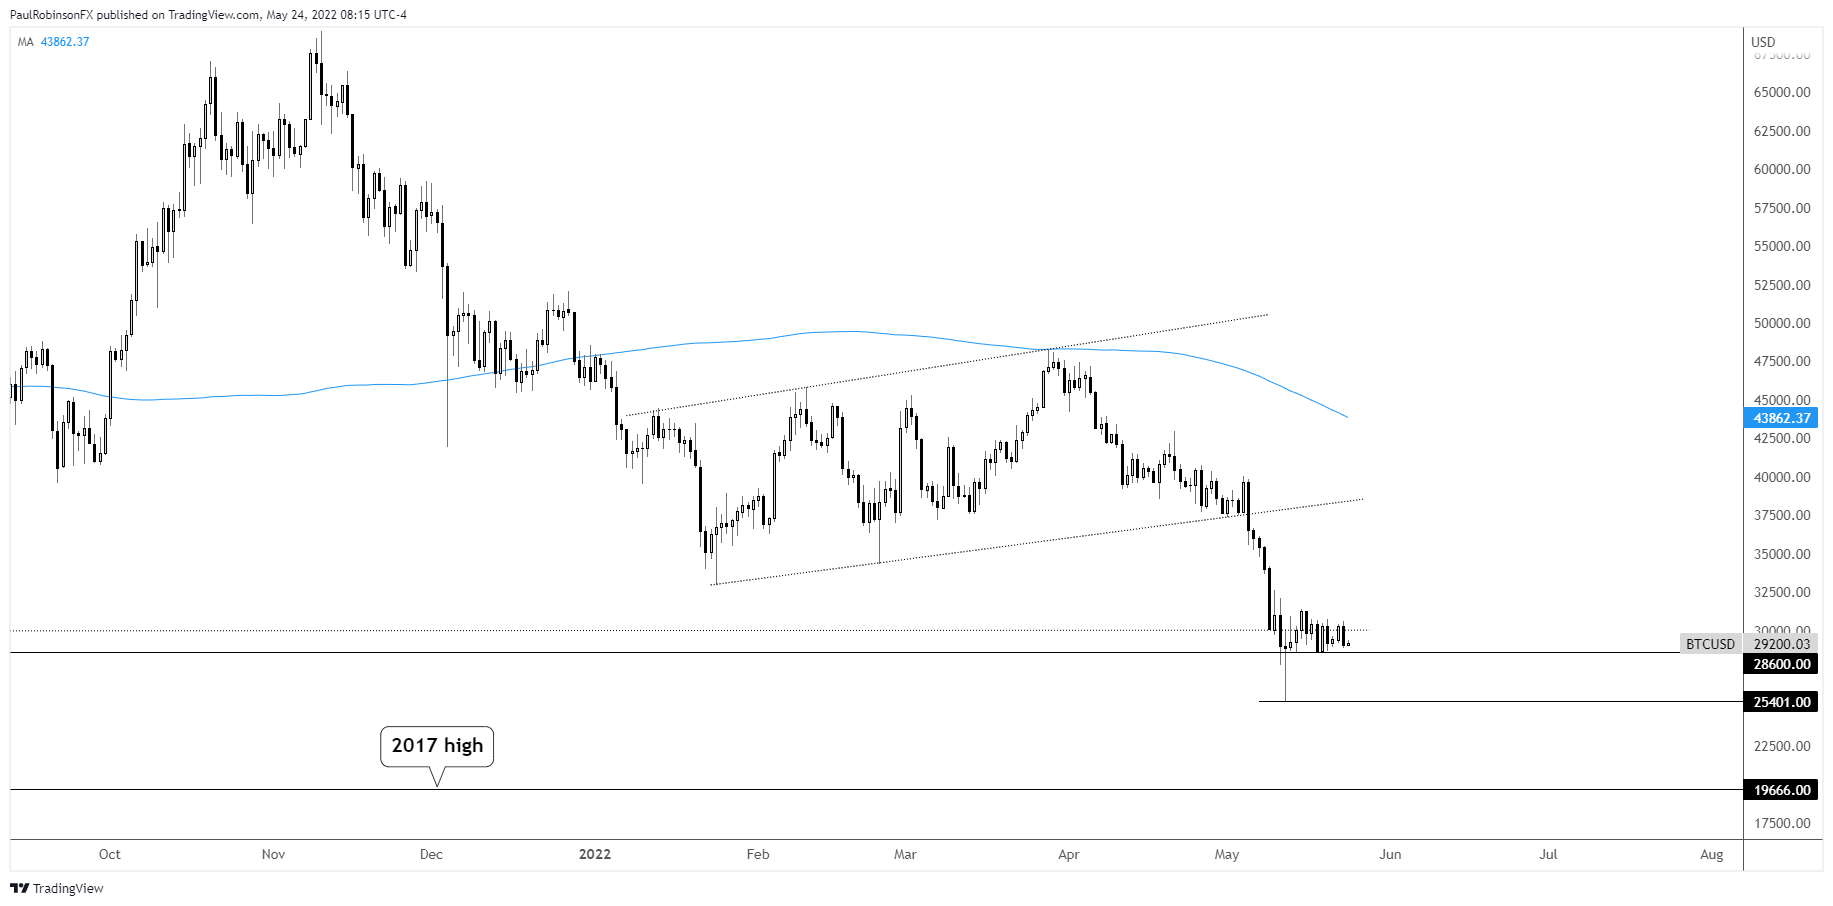
On May 12 BTC/USD sank through a big macro level of support and reversed powerfully for the day to close back above it. This was initially viewed as a positive, at least in the near-term. However, if BTC continues to tread water around 28600 the more likely it is to break.
Whenever you see price sit at a level after a large move, whether it be on the downside or topside, the more likely it is that the level is about to break and a continuation of the trend develop.
Given the significance of the support level at hand, a level that runs back to the beginning of 2021, and given the powerful reversal that came on the break earlier in the month, a breakdown here is seen as likely to send BTC/USD much lower.
Overall, the outlook for BTC/USD has been a bearish one, and with risk assets in general rolling downhill, it appears likely we see cryptos continue to get pummeled. At some point the hard selling is anticipated to turn into a drift lower as residual selling and a lack of buying interest see prices deflate at a persistent rate. But the latter behavior isn’t expected until more pain is experienced.
A break below 28600 will have the cycle low at 25401 in focus. A breakdown beneath that point is seen as having the 2017 high in play at 19666. This would be another significant point to watch BTC try and hold. It may hold initially, but more downside from there is anticipated as the selling turns from aggressive to a long slow drift.
For now, while the outlook is bearish we must respect support as support until broken. If we see BTC/USD pop hard from here that won’t get it out of the woods, but does save it for the time-being. Turning things around is going to require a significant shift in sentiment that doesn’t appear to be anywhere on the horizon.
BTC/USD Daily Chart
Resources for Forex Traders
Whether you are a new or experienced trader, we have several resources available to help you; indicator for tracking trader sentiment, quarterly trading forecasts, analytical and educational webinars held daily, trading guides to help you improve trading performance, and one specifically for those who are new to forex.
---Written by Paul Robinson, Market Analyst
You can follow Paul on Twitter at @PaulRobinsonFX


