BTC/USD Technical Outlook:
- Price action suggests we will see lower levels soon
- Big support lies down below under 30k


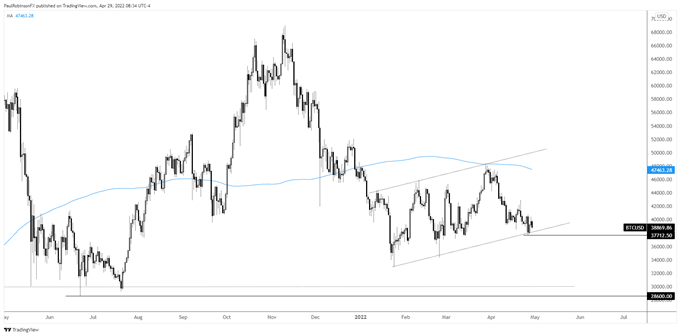
BTC/USD has lost a lot of its excitement in the past year, and that looks likely to continue as price action suggests we will see lower levels yet. Since the January low we have seen BTC try to put together a meaningful rally, but continually fail.
This price behavior is carving out a bear-flag, which implies another leg lower could be near. However, before trading offer further it is possible we see another swing higher as price sits on the lower parallel of the pattern.
If 37701 continues to hold then we must respect support, and would-be longs may look to this as a line-in-the sand for stop placement. On the flip-side, for those looking to sell they may want to use this as a reference point. Selling support or buying resistance is typically not a good approach, so waiting for the break is generally the most prudent approach.
In the event the bear-flag triggers, with a break below 37701 as confirmation (on a daily closing basis), then look for a run at major long-term support at 28600. There are several turning points near this point which fortify the zone from just above 30k to the 2021 low.
Trade to that point will be considered a major test of the long-term trend given it runs back to early 2021, furthermore a breaking of support would undermine the long-term tilt of the chart. A lower-low could prove to lead to much lower levels, next up I would be looking for the 2017 high at 19666 as the next stopping point.
BTC/USD Daily Chart

Resources for Forex Traders
Whether you are a new or experienced trader, we have several resources available to help you; indicator for tracking trader sentiment, quarterly trading forecasts, analytical and educational webinars held daily, trading guides to help you improve trading performance, and one specifically for those who are new to forex.
---Written by Paul Robinson, Market Analyst
You can follow Paul on Twitter at @PaulRobinsonFX


