


Euro, EUR/USD, EUR/JPY - Talking points
- EUR/USD is making new lows, but it might be stretching too far, too fast
- EUR/JPYis bouncing along the base of the range but is yet to break below prior lows
- Bearish momentum is unfolding, but are there reversals coming for the Euro?
Trade Smarter - Sign up for the DailyFX Newsletter
Receive timely and compelling market commentary from the DailyFX team
EUR/USD TECHNICAL OUTLOOK
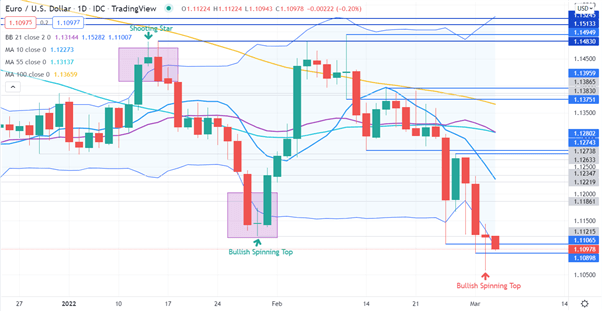
EUR/USD has some conflicting technical indicators. The next few days may reveal an outcome for directional price action.
Volatility has increased as illustrated by the widening of the 21-day simple moving average (SMA) based Bollinger Band s.
The price is currently below the lower band, but a close back inside the band could signal a reversal.
Another potential reversal signal for bulls is through a Spinning Top Candlestick pattern that emerged on yesterday’s close.
Conversely, a series of closes outside the lower Bollinger Band might signal the beginning of a bearish trend.
Looking at the 21 and 55-day SMAs, there could be a Death Cross about to emerge that may signal bearish momentum is evolving should the 21-day SMA cross below the 55-day SMA.
A bearish triple moving average (TMA) formation requires the price to be below the short term SMA, the latter to be below the medium term SMA and the medium term SMA to be below the long term SMA. All SMAs also need to have a negative gradient.
Looking at the 10, 55 and 100-day SMAs, the criteria for a TMA has been met.
The price action over the next few sessions could be crucial medium term direction.
Support may lie at the previous lows of 1.11065 and 1.10898.
On the topside, resistance could be offered at the recent high and pivot point of 1.12743 and 1.12803 respectively.
Introduction to Technical Analysis
Learn Technical Analysis
Recommended by Daniel McCarthy
EUR/JPY TECHNICAL ANALYSIS
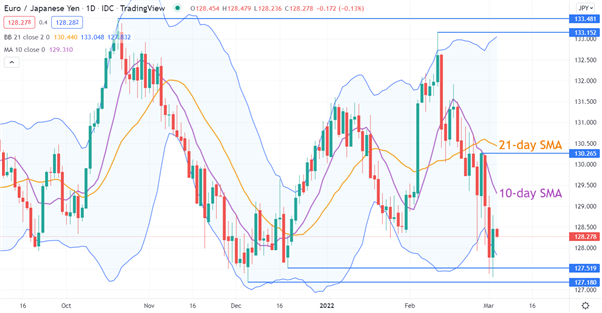
EUR/JPY has been caught in the broad range of 127.180 – 133.481 since June last year.
Two recent attempts to break the lower end of that range have so far been rejected.
Those attempts broke below the lower band of the 21-day simple moving average (SMA) based Bollinger Band s. Yesterday’s close was back inside the band and could signal a reversal.
The 10-day SMA has recently been pivotal for EUR/JPY and should the price cross back above it, it may confirm that the base of the wide range remains in place.
It should be noted though that past performance is not indicative of future results.
Support might lie at the historical lows of 127.519 and 127.180, while nearby resistance could be at the 10-day SMA and the recent peak of 130.265.
--- Written by Daniel McCarthy, Strategist for DailyFX.com
To contact Daniel, use the comments section below or @DanMcCathyFX on Twitter


