


S&P 500, Dow Jones, Technical Analysis, Retail Trader Positioning - Talking Points
- Retail traders aggressively sold recent gains on Wall Street
- Does this hint the Dow Jones and S&P 500 could extend gains?
- Both face key incoming resistance levels, will uptrend resume?

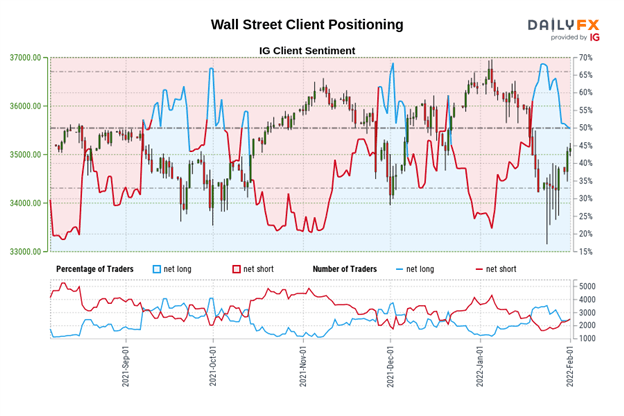
According to IG Client Sentiment (IGCS), retail investors are increasingly betting that equities may weaken in the near term. Downside exposure is on the rise in the Dow Jones and S&P 500. At times, IGCS can be a contrarian indicator. If this trend in positioning extends, then volatility on Wall Street could continue cooling ahead. Fur a further breakdown of this tool, which includes fundamental analysis, check out the recording of this week’s webinar above!
Dow Jones Sentiment Outlook - Bullish
The IGCS gauge shows that 49.84% of retail traders are net-long the Dow Jones. Since the majority of traders are net-short, this suggests prices may continue rising. Upside exposure increased by 7.8% and 49.86% compared to yesterday and last week respectively. The combination of overall and recent changes in positioning are offering a bullish contrarian trading bias.
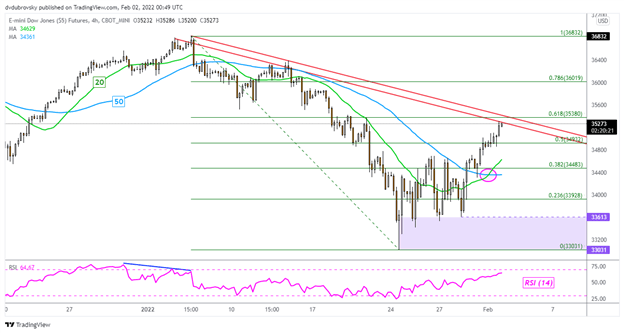
Dow Jones Futures 4-Hour Chart
On the 4-hour chart, Dow Jones futures are facing a combination of a near-term falling trendline from the beginning of January and the 61.8% Fibonacci retracement at 35380. This follows a bullish crossover between the 20- and 50-period Simple Moving Averages (SMAs). Breaking above key resistance could open the door to extending gains towards the January peak at 36832. Otherwise, a turn lower may place the focus back on the 33031 – 33613 support zone.
Introduction to Technical Analysis
Learn Technical Analysis
Recommended by Daniel Dubrovsky
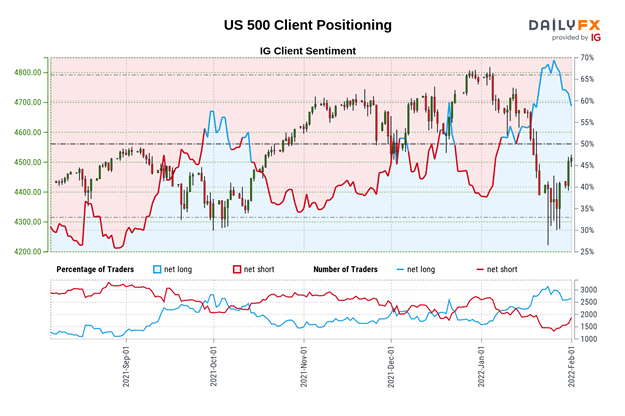
S&P 500 Sentiment Outlook - Bullish
The IGCS gauge shows that roughly 58% of retail traders are net-long the S&P 500. Since the majority of traders are still biased to the upside, this suggests prices may fall. However, downside exposure increased by 14.91% and 44.52% respectively. The combination of overall and recent changes in retail trader positioning is offering a bullish contrarian bias.
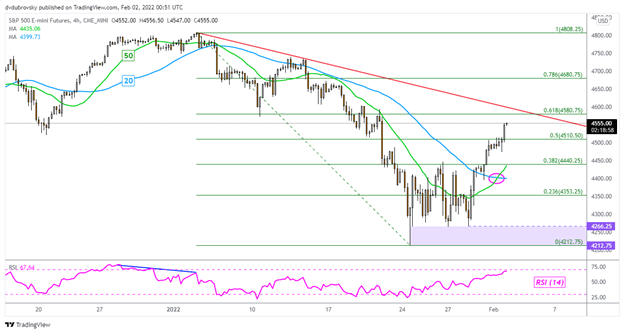
S&P 500 Futures 4-Hour Chart
On the 4-hour chart, S&P 500 futures have cleared the midpoint of the Fibonacci retracement at 4510. That has exposed the 61.8% level at 4580 as well as a potential falling trendline from the beginning of January. A bullish crossover recently formed between the 20- and 50-period SMAs. This may hint at further gains. Clearing the 61.8% retracement as well as the potential trendline may open the door to extending gains towards the current 2022 peak at 4808. Otherwise, turning lower may see the 4212 – 4266 support zone come back into focus.

*IG Client Sentiment Charts and Positioning Data Used from February 1st Report
--- Written by Daniel Dubrovsky, Strategist for DailyFX.com
To contact Daniel, use the comments section below or @ddubrovskyFX on Twitter


