


Japanese Yen, USD/JPY, CHF/JPY - Talking Points
- USD/JPY looks to new highs as potential bullish momentum unfolds
- Bollinger Band indicators might provide clues for CHF/JPY moves
- JPY crosses are marching up inside recent ranges. Will a Yen trend emerge?
Introduction to Technical Analysis
Learn Technical Analysis
Recommended by Daniel McCarthy
USD/JPY – Technical Analysis
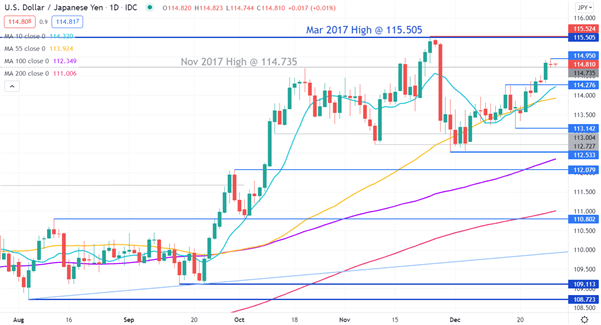
USD/JPY moved above a recent high at 114.276 last week and has continued higher this week. That level may provide pivot point support.
Support could also be at the previous lows and pivot points of 113.142, 112.533, 112.079, 110.802, 109.113 and 108.723.
A bullish triple moving average (TMA) formation requires the price to be above the short term SMA, the latter to be above the medium term SMA and the medium term SMA to be above the long term SMA. All SMAs also need to have a positive gradient.
The 10, 55 and 200-day simple moving averages (SMA) meet all of these requirements and this might indicate that bullish momentum is evolving.
On the topside, the March 2017 high of 115.505 and the recent peak at 115.524 may offer resistance. Near term resistance could be at the recent high of 114.95.

CHF/JPY – Technical Analysis
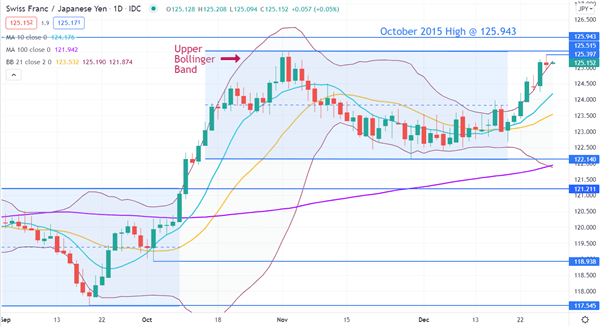
In early October, CHF/JPY broke out of a 4-month range only to move higher and establish a new range. Since mid-October it has been caught between 122.140 and 125.515
The high of 125.515 in early November was shy of the October 2015 high of 125.943 and these levels might provide resistance.
The most recent move up has seen a high of 125.397 and it has traded above the 21-day simple moving average (SMA) based Bollinger Band s for several sessions. A close back inside the band could indicate that a near term reversal may unfold.
The width of the Bollinger Bands has increased with the rally, which illustrates increasing volatility going into year end.
On the downside, support may lie at the previous low of 122.140 or the 10 and 21-day SMAs, currently at 124.176 and 123.532 respectively.
Introduction to Technical Analysis
Moving Averages
Recommended by Daniel McCarthy
--- Written by Daniel McCarthy, Strategist for DailyFX.com
To contact Daniel, use the comments section below or @DanMcCathyFX on Twitter


