


Gold, XAU/USD, CPI, US Dollar, Fed, Technical Analysis - Talking Points:
- Gold prices marked time as traders await US CPI report
- Elevated inflation may boost hawkish Fed policy estimates
- That may send XAU/USD towards lows from September

Gold prices marked time on Thursday as the yellow metal was influenced by diverging fundamental forces. The anti-fiat yellow metal tends to be quite sensitive to movements in the US Dollar and Treasury yields. When the latter two are moving in the same direction, that is when gold can have relatively stronger trends. In this case, the US Dollar gained as bond yields weakened.
This divergence left the metal in a consolidative state as traders await Friday’s US CPI report. Headline inflation is expected to clock in at 6.8% y/y in November from 6.2% prior. This would be the fastest pace in almost 40 years. The core rate, which strips out volatile food and energy prices, is anticipated to cross the wires at 4.9% y/y. The latter is already running around 30-year highs.
With inflation far above the Federal Reserve’s target of averaging 2% in the long run, another strong reading could further boost hawkish monetary policy expectations. The central bank may even speed up the pace of tapering asset purchases at this month’s interest rate decision. As such, this is leaving gold vulnerable to a combination of rising front-end Treasury yields and a stronger US Dollar.
Check out the DailyFX Economic Calendar for more key events!
Gold Technical Analysis
On the 4-hour chart, XAU/USD has broken under a near-term rising trendline from the beginning of this month. This leaves gold facing the 1771 inflection point, with the key 1757 – 1763 support zone immediately below. A drop under the latter may open the door to extending losses towards the September low. Otherwise, immediate resistance seems to be at 1793.

XAU/USD 4-Hour Chart
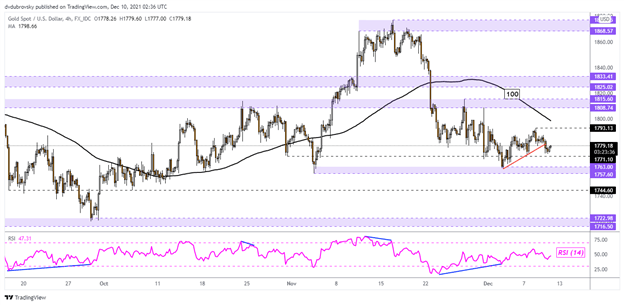
Chart Created Using TradingView
Gold Sentiment Analysis - Bearish
According to IG Client Sentiment (IGCS), about 83% of retail traders are net-long gold. IGCS tends to be a contrarian indicator. Since most traders are biased to the upside, this suggests prices may fall. Moreover, upside exposure increased by 0.75% and 1.30% over a daily and weekly basis respectively. The combination of overall positioning and recent shifts are offering a bearish contrarian trading bias.
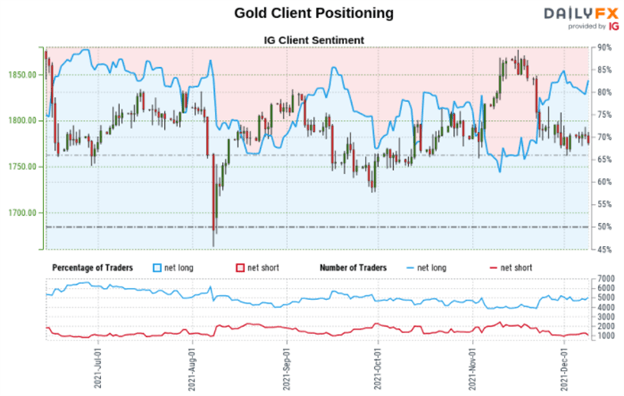
*IGCS chart used from December 9th report
--- Written by Daniel Dubrovsky, Strategist for DailyFX.com
To contact Daniel, use the comments section below or @ddubrovskyFX on Twitter


