


Japanese Yen, AUD/JPY, USD/JPY, Technical Analysis, Retail Trader Positioning - Talking Points
- Retail traders bet Yen may fall vs. AUD but rise against USD
- IG Client Sentiment can at times be a contrarian indicator
- Will AUD/JPY fall as USD/JPY rises? Eyes on SMAs, wedge

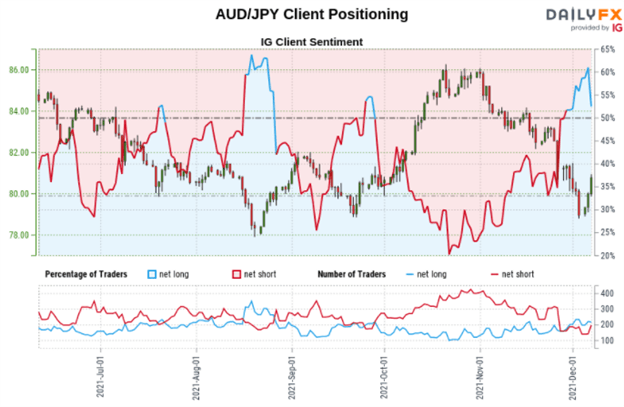
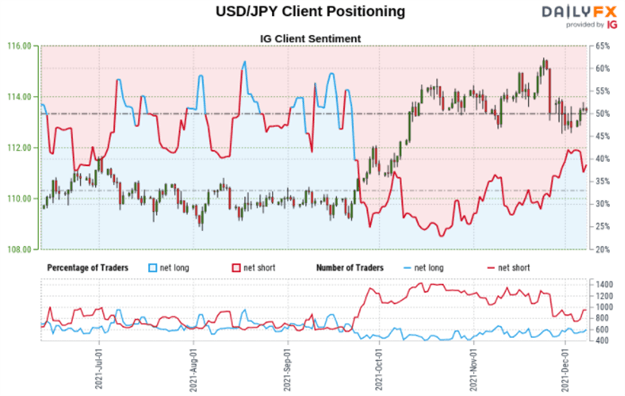
Taking a look at IG Client Sentiment (IGCS), retail traders are betting that the Japanese Yen may weaken against the Australian Dollar but rise against the US Dollar. In other words, they are net-long AUD/JPY while simultaneously net-short USD/JPY. IGCS can at times be a contrarian indicator. If this makeup in positioning holds, will AUD/JPY continue falling as USD/JPY rises?
AUD/JPY Sentiment Outlook - Bearish
The IGCS gauge implies that roughly 57% of retail traders are net-long AUD/JPY. Since the majority of traders are biased to the upside, this suggests prices may continue falling. Net-short positioning declined by 17.79% and 0.58% compared to a day and week ago respectively. The combination of current and recent shifts in positioning is offering a stronger bearish contrarian trading bias.

Technical Analysis
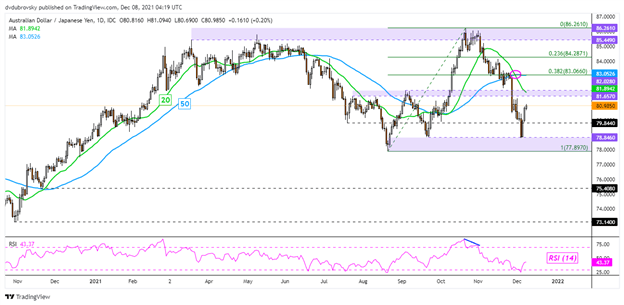
While AUD/JPY remains in a near-term downtrend since early November, the pair could be readying to push higher within the context of neutral price action since earlier this year. Prices recently bounced off the 78.000 – 79.844 support zone, positioning the pair to potentially face the 20-day Simple Moving Average (SMA). Still, there was a bearish ‘Death Cross’ with the 50-day line in late November. This is underpinning a downward technical bias, with room to rise before the SMAs kick in as potential resistance.
AUD/JPY Daily Chart
USD/JPY Sentiment Outlook - Bullish
The IGCS gauge implies that about 37% of retail investors are net-long USD/JPY. Since most traders are net-short, this suggests prices may continue rising. Downside exposure has climbed by 6.07% and 15.28% compared to a day and weekly ago respectively. The combination of current and recent shifts in positioning is offering a stronger bullish contrarian trading bias.
Technical Analysis
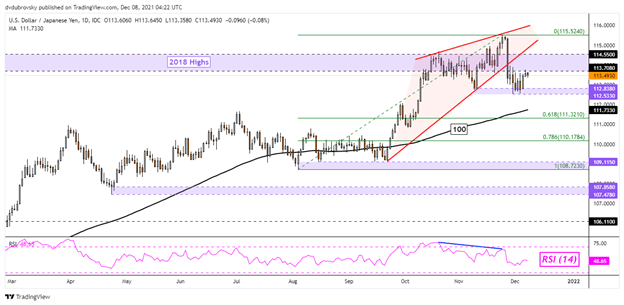
USD/JPY remains under a bearish Rising Wedge chart formation, offering a downward risk. However, the key 112.53 – 112.83 support zone still remains in play. A breakout under this zone could open the door to extending losses. In such an outcome, the 100-day SMA could reinstate an upward technical bias. Resuming the uptrend since the beginning of this year entails clearing the November high at 115.524.
USD/JPY Daily Chart
*IG Client Sentiment Charts and Positioning Data Used from December 7th Report
--- Written by Daniel Dubrovsky, Strategist for DailyFX.com
To contact Daniel, use the comments section below or @ddubrovskyFX on Twitter


