


Japanese Yen, USD/JPY, AUD/JPY, NZD/JPY - Talking Points
- USD/JPY was left directionless last week as it remained trapped between levels
- Bollinger Band indicators highlight AUD/JPY volatility as new lows were hit
- NZD/JPY moved to 3-month low last week. Will Yen continue to rally?
Introduction to Technical Analysis
Learn Technical Analysis
Recommended by Daniel McCarthy
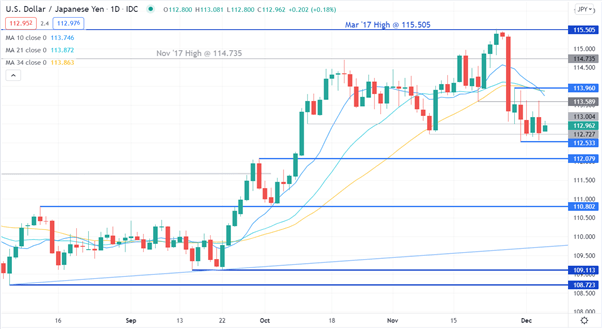
USD/JPY – Technical Analysis
USD/JPY spent last week consolidating in a 112.533 – 113.96 range. At the top end of this range, the 10, 21 and 34-day simple moving averages (SMA) are congregating with a negative slope.
This might suggest that the area between 113.746 and 113.960 could offer resistance. Further up, the March 2017 peak and the recent high at 115.505 may also offer resistance.
On the downside, support could be at the previous lows and pivot points of 112.533, 112.079, 110.802, 109.113 and 108.723.

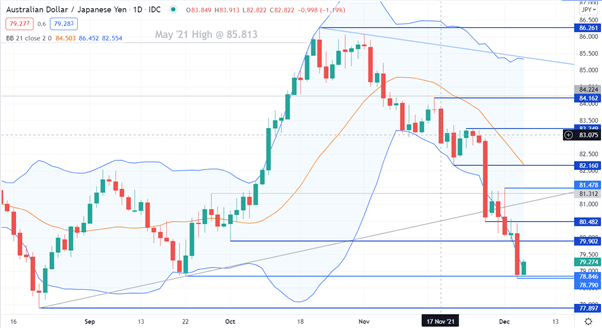
AUD/JPY – Technical Analysis
AUD/JPY broke down through two support levels last week at 80.482 and 79.902 and these levels might offer pivot point resistance now. Further up, a series of previous highs and pivot points might offer resistance at 81.478, 82.160, 83.249, 84.162 and 86.261.
The low on Friday 0f 78.790 was just below a previous low of 78.846. These two levels could provide support. Further down, the August low of 77.897 might provide support.
This move down has the price below the lower band of 21-day SMA based Bollinger Band. It has traded below the lower band for a week and has closed outside of it every day, with the exception of one day where it narrowly closed inside.
This could suggest that bearish volatility is still in play. The heightened level of volatility can be observed by the width of the Bollinger Band s themselves.
Introduction to Technical Analysis
Moving Averages
Recommended by Daniel McCarthy
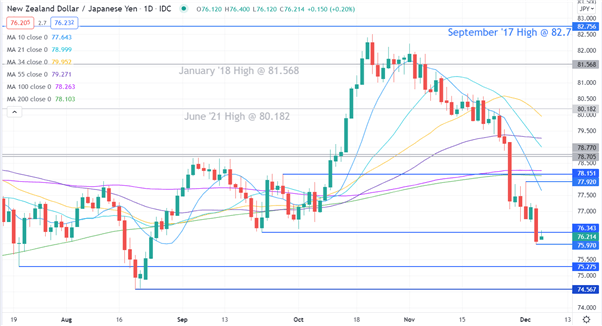
NZD/JPY – Technical Analysis
NZD/JPY took out several previous highs last month but fell short of the September 2017 high of 82.756. It has since plunged to make a low at 75.970 to end last week.
The pace of the move down has seen the short term simple moving averages (SMA) steepen into a negative gradient. The medium and long term SMAs have flatlined for now as they appear to be potentially rolling over into a negative slope.
This could suggest that short term momentum is bearish while medium and long term momentum might be neutral.
The low from Friday at 75.97 may provide support and below there, other potential support levels might be at the pivot point of 75.275 or another prior low of 74.567.
--- Written by Daniel McCarthy, Strategist for DailyFX.com
To contact Daniel, use the comments section below or @DanMcCathyFX on Twitter


