


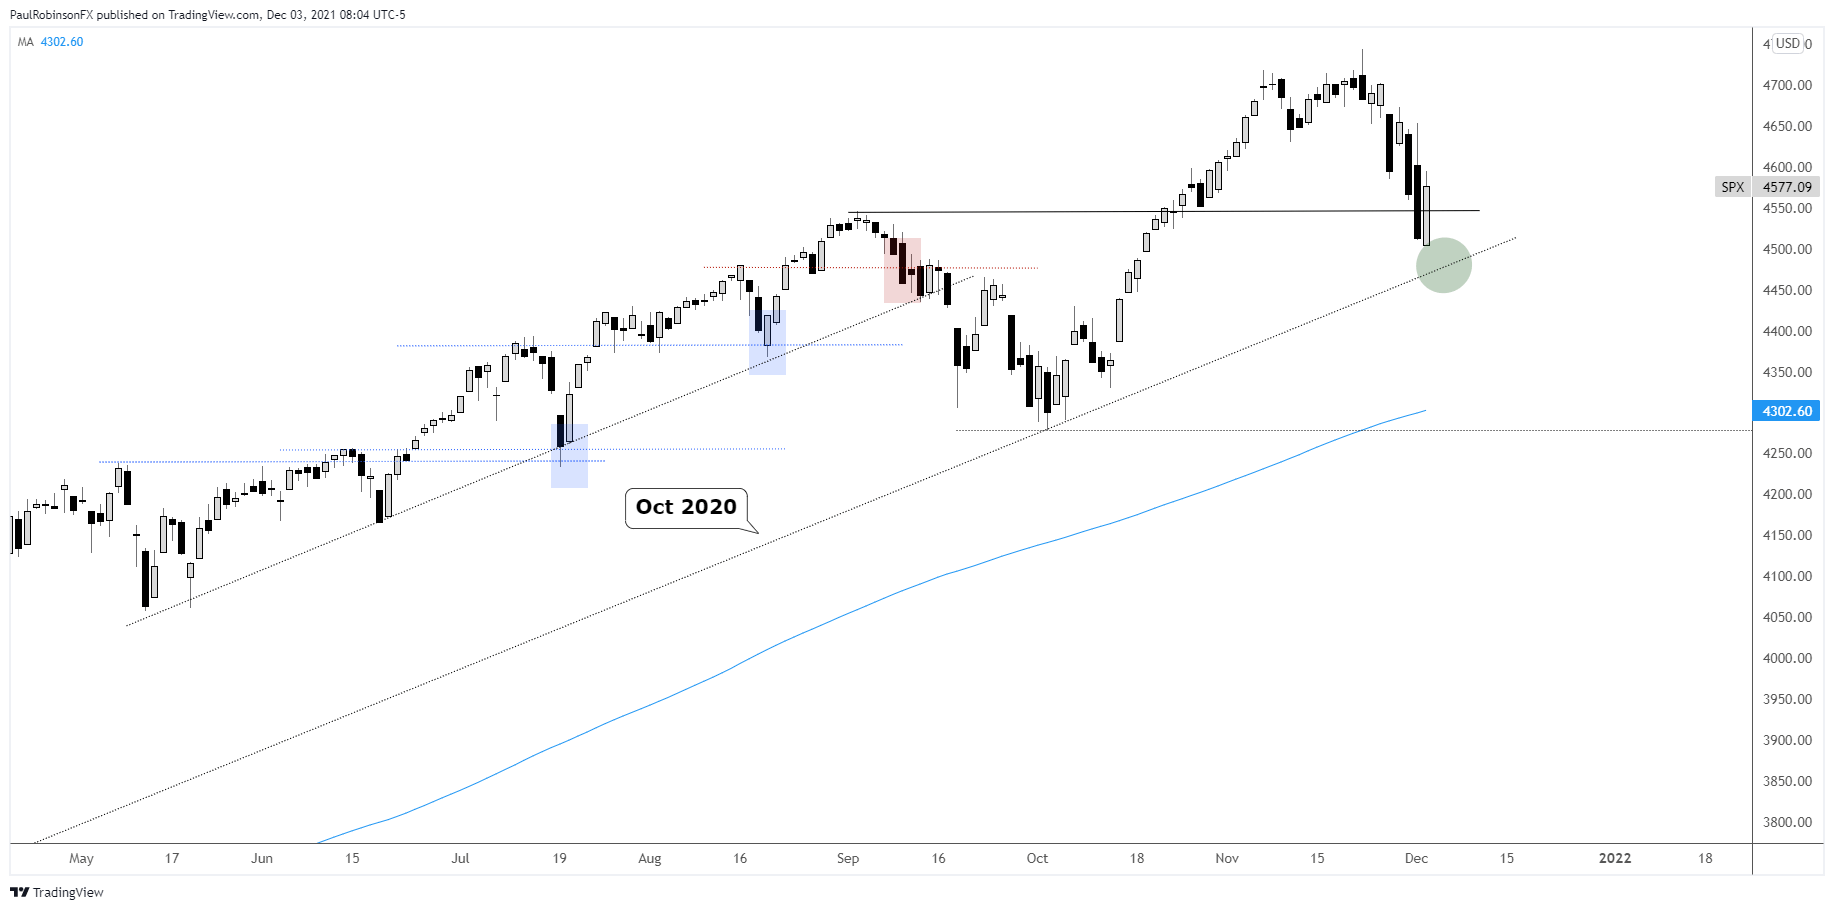
In today’s video, I discussed a number of charts of major macro markets and their outlook. To begin with, the S&P 500 has been volatile and trading around a key level of support via the former record high set in early September. There is a trend-line from October 2020 to keep an eye on. Yesterday could have marked a low, but it may be premature to get too bullish as the downside may still present trouble for longs. We’ll touch base on this one soon as price action unfolds.
S&P 500 Daily Chart
Just yesterday I was discussing oil and the outlook was that we would head lower before higher. The key to this outlook, though, hinged on price action around support. Seeing some type of reversal or Monday gap lower get filled was the preferred signal that oil is ready to turn higher. We saw just that in yesterday’s trade, a strong reversal to the upside that now has oil looking at least neutral, and likely bullish. Keep an eye on the 200-day moving average just ahead at 69.90.

Crude Oil Daily Chart

Crude Oil Chart by TradingView
Gold has been relatively directionless the past few months, and it is unclear when that will end. It is currently sitting on ‘hidden’ support around the 1765 level, an area that has been in play on numerous occasions since May 2020. Price action isn’t particularly appealing at this juncture for it too hold, which may take gold down to a trend-line dating to the March 2020 low.
For the full details, please check out the video above…
Gold Daily Chart

Resources for Forex Traders
Whether you are a new or experienced trader, we have several resources available to help you; indicator for tracking trader sentiment, quarterly trading forecasts, analytical and educational webinars held daily, trading guides to help you improve trading performance, and one specifically for those who are new to forex.
---Written by Paul Robinson, Market Analyst
You can follow Paul on Twitter at @PaulRobinsonFX


