


Euro, EUR/USD, EUR/NOK - Talking points
- EUR/USD broke many support levels to make a new low for 2021
- EUR/NOK is consolidating higher off the low as it eyes higher resistance
- Momentum is working against EUR/USD. Can the Euro find a base?

EUR/USD TECHNICAL OUTLOOK
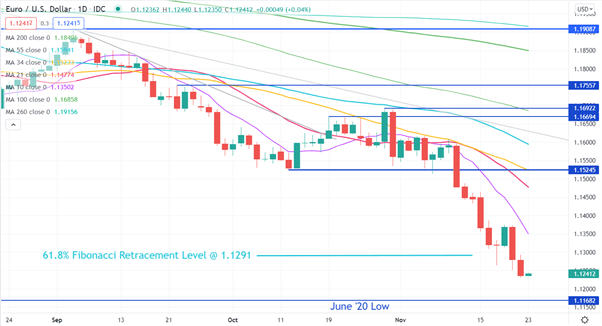
After breaking below last month’s low of 1.15245, EUR/USD has moved aggressively lower.
On the run down, it paused at the 61.8% Fibonacci Retracement of the move from 1.0638 to 1.2350 of 1.1292. It has since continued downward to bring into view the June 2020 low of 1.11682, which could provide support.
A bearish triple moving average (TMA) formation requires the price to be below the short term SMA, the latter to be below the medium term SMA and the medium term SMA to be below the long term SMA. All SMAs also need to have a positive gradient.
Looking at the 10, 55 and 200-day SMAs, all of these conditions have been met. However, if we took any combination of the 10, 21, 34, 55, 100, 200 and 260-day SMAs, these conditions would be met.
This might suggest bearish momentum is intact. It should be noted though that past performance is not indicative of future results.
On the topside, nearby resistance could at the 10, 21 and 34-day SMAs. The latter currently coincides with a pivot point at 1.15245.
Introduction to Technical Analysis
Moving Averages
Recommended by Daniel McCarthy
EUR/NOK TECHNICAL ANALYSIS
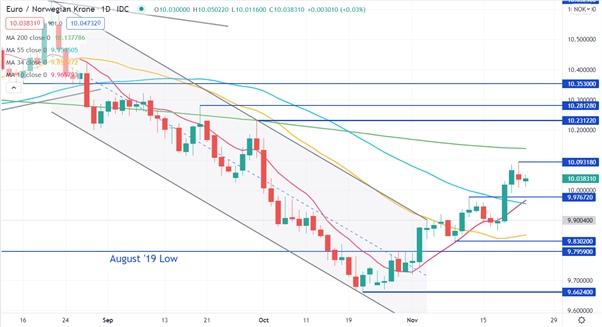
When making a 2-year low last month, EUR/NOK broke below the August 2019 low of 9.7959.
On the move back up, it provided some resistance before being broken and it has now become a pivot point that could provide support. Support may also lie at the 9.8767 pivot point or the prior lows of 9.8302 and 9.6624
On the rally back up, EUR/NOK penetrated above a descending channel.
This move saw some bullishness evolve as indicated by the 10-day simple moving average (SMA) initially crossing the 34-day SMA, and then just recently, it crossed above the 55-day SMA. These Golden Crosses might indicate that short and medium-term bullish momentum may unfold.
On the topside, the 200-day SMA, currently at 10.1377,may offer resistance. Further up, the previous highs at 10.09318, 10.23122 and 10.28128 are possible resistance levels as well as the pivot point at 10.3530.
--- Written by Daniel McCarthy, Strategist for DailyFX.com
To contact Daniel, use the comments section below or @DanMcCathyFX on Twitter


