


US Dollar Talking Points:
- The US Dollar has finally found a pause point in its recent breakout.
- This webinar looked across a number of USD setups along with a few other, such as GBP/JPY.
- The analysis contained in article relies on price action and chart formations. To learn more about price action or chart patterns, check out our DailyFX Education section.

The US Dollar has finally found a pause point in its breakout, and this has showed up just inside of the final target from the Q4 technical forecast, which is housed at the 96.47 Fibonacci level. In this webinar, I looked at how to work around this theme with full recognition of just how powerful that breakout has become.
The current resistance is holding around the 50% marker of last year’s sell-off, and there’s a few other Fibonacci levels lodged within tight proximity; producing an opportune area for the USD trend to take a break after an aggressive topside stretch that’s seen both Daily and Weekly RSI move into overbought territory.
US Dollar Weekly Price Chart
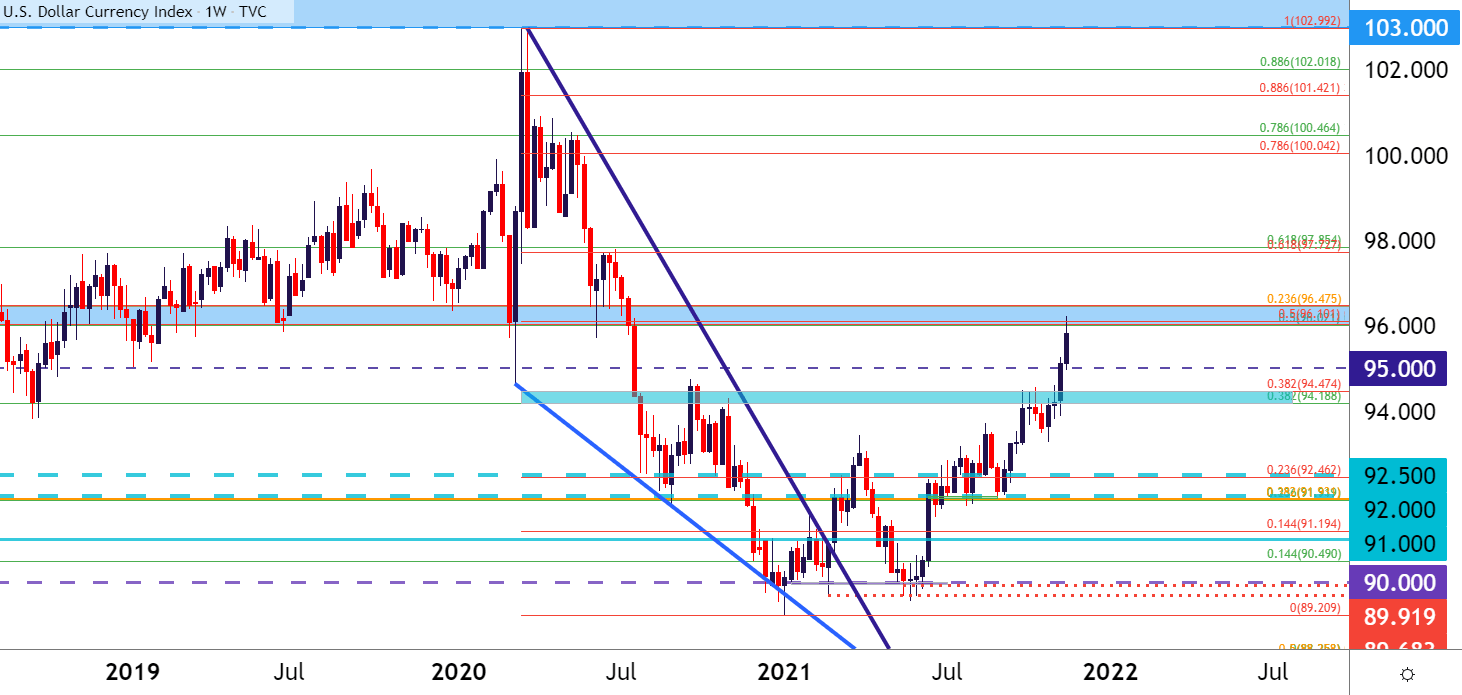
Chart prepared by James Stanley; USD, DXY on Tradingview
EUR/USD – The Falling Knife
Powering that breakout in the USD has been a dramatic drop in the Euro with EUR/USD putting in a significant move over the past week.
Trying to catch the long side here could be akin to catching a falling knife. But, the support level highlighted yesterday appears to be putting in some work around the 1.1291 Fibonacci level as there’s been a short-term build of support here. The next zone of resistance higher runs from around 1.1355-1.1385, and the 1291 Fibonacci level may hold long enough to bring prices back up to that spot of possible lower-high resistance.
EUR/USD Hourly Price Chart
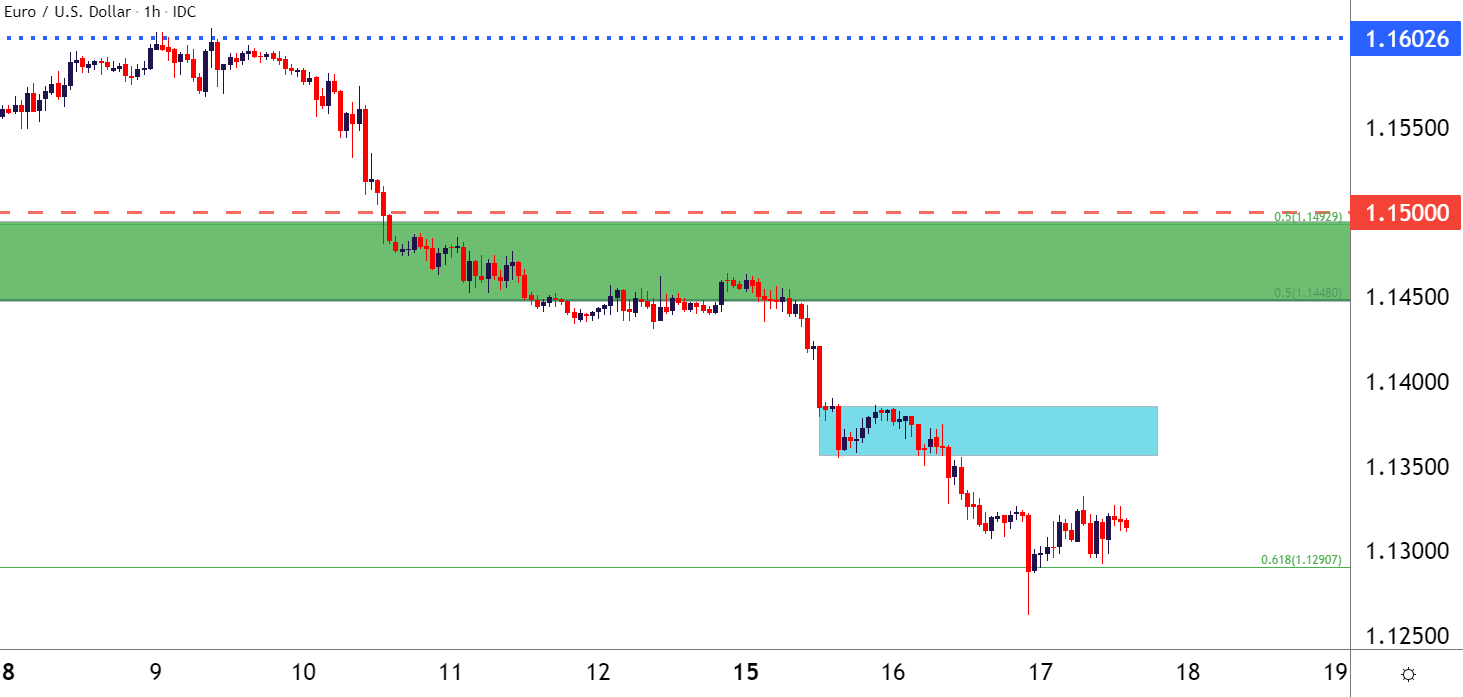
Chart prepared by James Stanley; EURUSD on Tradingview
GBP/USD: Resistance Test
For those looking to hit the long side of the US Dollar, GBP/USD may be in an interesting spot. I had looked at the 1.3500 psychological level for lower-high resistance potential and price action continues to crawl up to this spot on the chart. At this point, all that we have is the bullish jump up to this level, but this may be opening the door for bullish continuation scenarios around the USD.
GBP/USD Hourly Price Chart
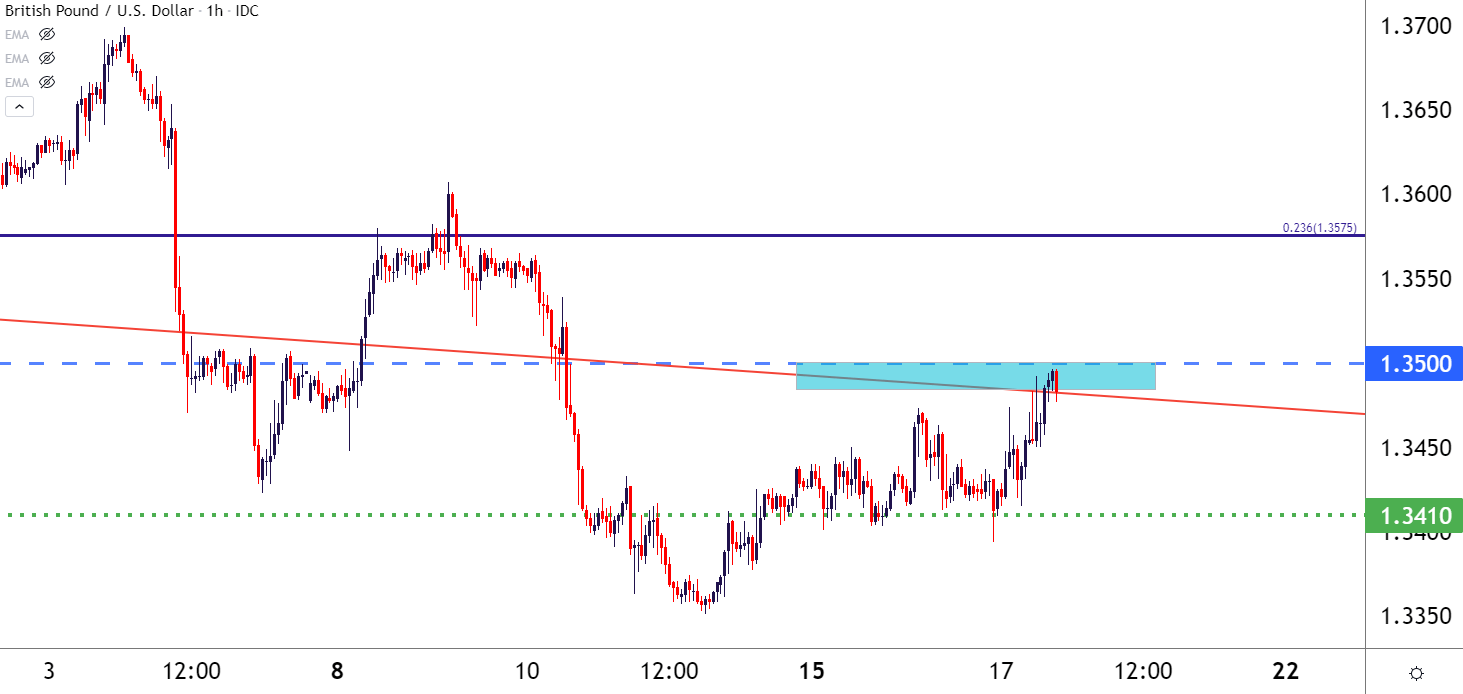
Chart prepared by James Stanley; GBPUSD on Tradingview
USD/CAD Stretch to Resistance
With oil prices coming off today, there’s been some additional CAD-weakness added into the mix. I’ve been following the topside of the pair since before last week’s breakout at the 1.2500 level. That led to a push up to Fibonacci resistance at 1.2589, which was followed by a pullback to support at 1.2500 followed by another bullish move.
At this point, a key zone has come back into the equation at 1.2621-1.2632. This was the same area that helped to hold the lows in the pair at the very beginning of the year.
USD/CAD Daily Price Chart

Chart prepared by James Stanley; USDCAD on Tradingview
USD/JPY Slide to Support
Another area to follow for USD bulls – USD/JPY. The pair came very close to hitting the 115 psychological level yesterday, coming just 3 pips shy of the high watermark.
That’s led to a pullback to a key spot of support around the 114.00 handle, an area of prior resistance where a Fibonacci retracement is located, as this is the 23.6% marker of the 2012-2015 major move in the pair. A little lower, around 113.74, is prior range support.
USD/JPY Hourly Price Chart

Chart prepared by James Stanley; USDJPY on Tradingview
--- Written by James Stanley, Senior Strategist for DailyFX.com
Contact and follow James on Twitter: @JStanleyFX


