


Bitcoin, Ethereum Talking Points:
- It’s been a fast pullback to start the week in the crypto space with both Bitcoin and Ethereum shedding more than 10% from last week’s highs.
- While Bitcoin had more mean reversion over the past month, Ethereum has spent much of that time holding within an aggressively bullish channel, which has just given way. But buyers have been quick to back support above the 4k level.
- The analysis contained in article relies on price action and chart formations. To learn more about price action or chart patterns, check out our DailyFX Education section.

It’s been a fast move in the crypto space as price action has started to pull back. In Bitcoin, prices are about 12% below last week’s highs and it’s been fast move to start the week. That high last week printed right at $69,000, and since then price action has taken on a different tone with a streak of selling.
But, BTC/USD prices are right now finding support around a key spot on the chart, the same that’s been setting support in various ways over the past month. This is where the 60k psychological level lives and that’s been somewhat of a sticking point for bulls since mid-October.
This level was probed through earlier in the day only for buyers to push prices back-above. But until a greater topside move shows, the potential remains for a deeper pullback. A little lower on the chart is a bit of reference, taken from a prior Fibonacci retracement. The 23.6% retracement of the April-June pullback rests at 56,377, and this price was in the equation in late-October during a similar occurrence. At that point, buyers stepped in before the level could come into play and that led to a bounce that brought on another fresh all-time-high.
Bitcoin (BTC/USD) Four-Hour Price Chart

Chart prepared by James Stanley; Bitcoin on Tradingview
Ethereum Falls from Bullish Channel Support
While Bitcoin has been fairly range-bound over the past month, Ethereum has been anything but, spending most of that time riding higher in a bullish channel to fresh all-time-highs. The token also set a fresh ATH last Wednesday and that led to a pullback down to channel support, a more restrained move than what showed above in Bitcoin: But sellers took a shot this morning in pushing ETH/USD down towards the 4k handle.
There’s a point of prior resistance around the 4200 level that had helped to cauterize the highs in May, and that may be playing an assist at support here. But, already this week-long pullback has allowed for an overbought and divergent RSI reading to come off and test below the 50-level.
Amongst the major cryptocurrencies, Ethereum may continue to hold some allure given its usability with NFTs and smart contracts; themes that became very relevant during this most recent bull run, and the current pull back in Ethereum can highlight just how optimistic bulls might continue to be.
That 4k level will be huge for bulls as this is confluent with the 38.2% Fibonacci retracement of the most recent major move. A bit lower, around 3750, is where traders can look for invalidation of the bullish trend; if prices fall below that, a deeper retracement may be in the works towards the 3200 level.
Ethereum (ETH/USD) Daily Price Chart
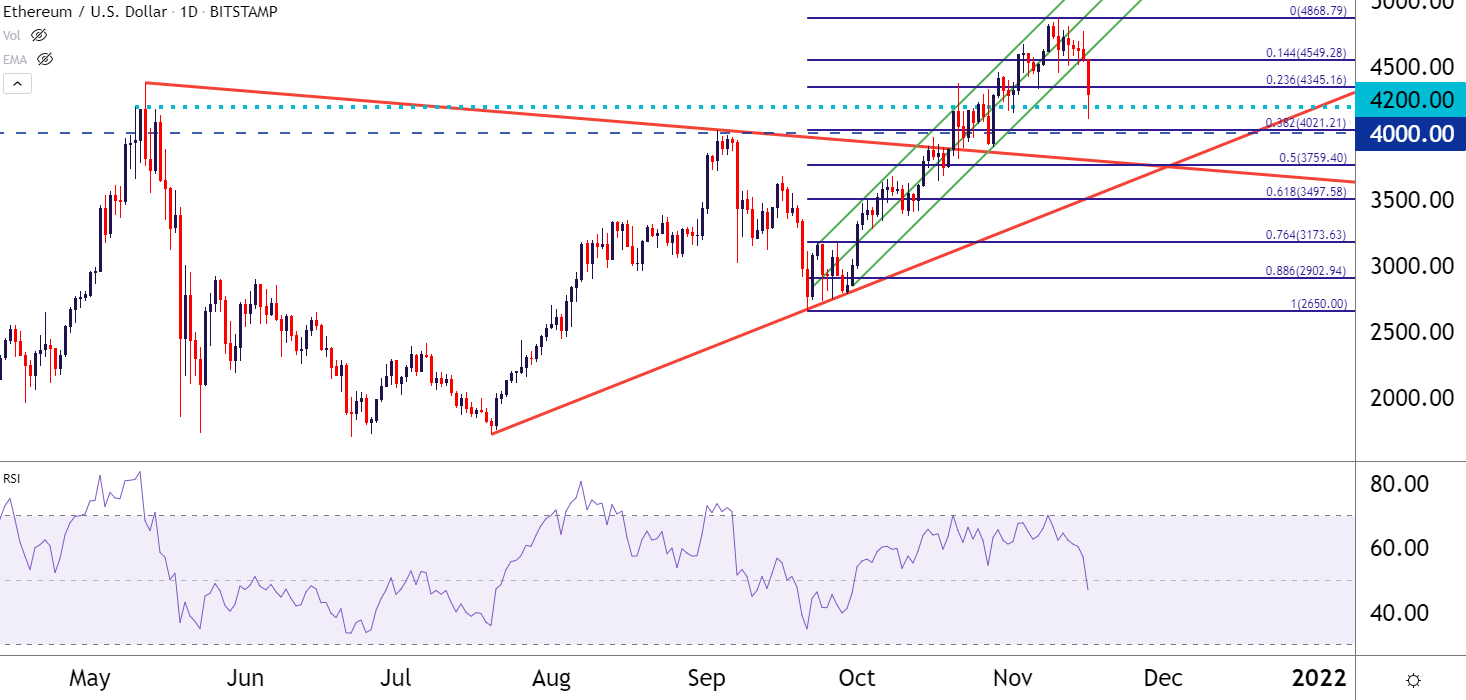
Chart prepared by James Stanley; Ethereum on Tradingview
--- Written by James Stanley, Senior Strategist for DailyFX.com
Contact and follow James on Twitter: @JStanleyFX


