


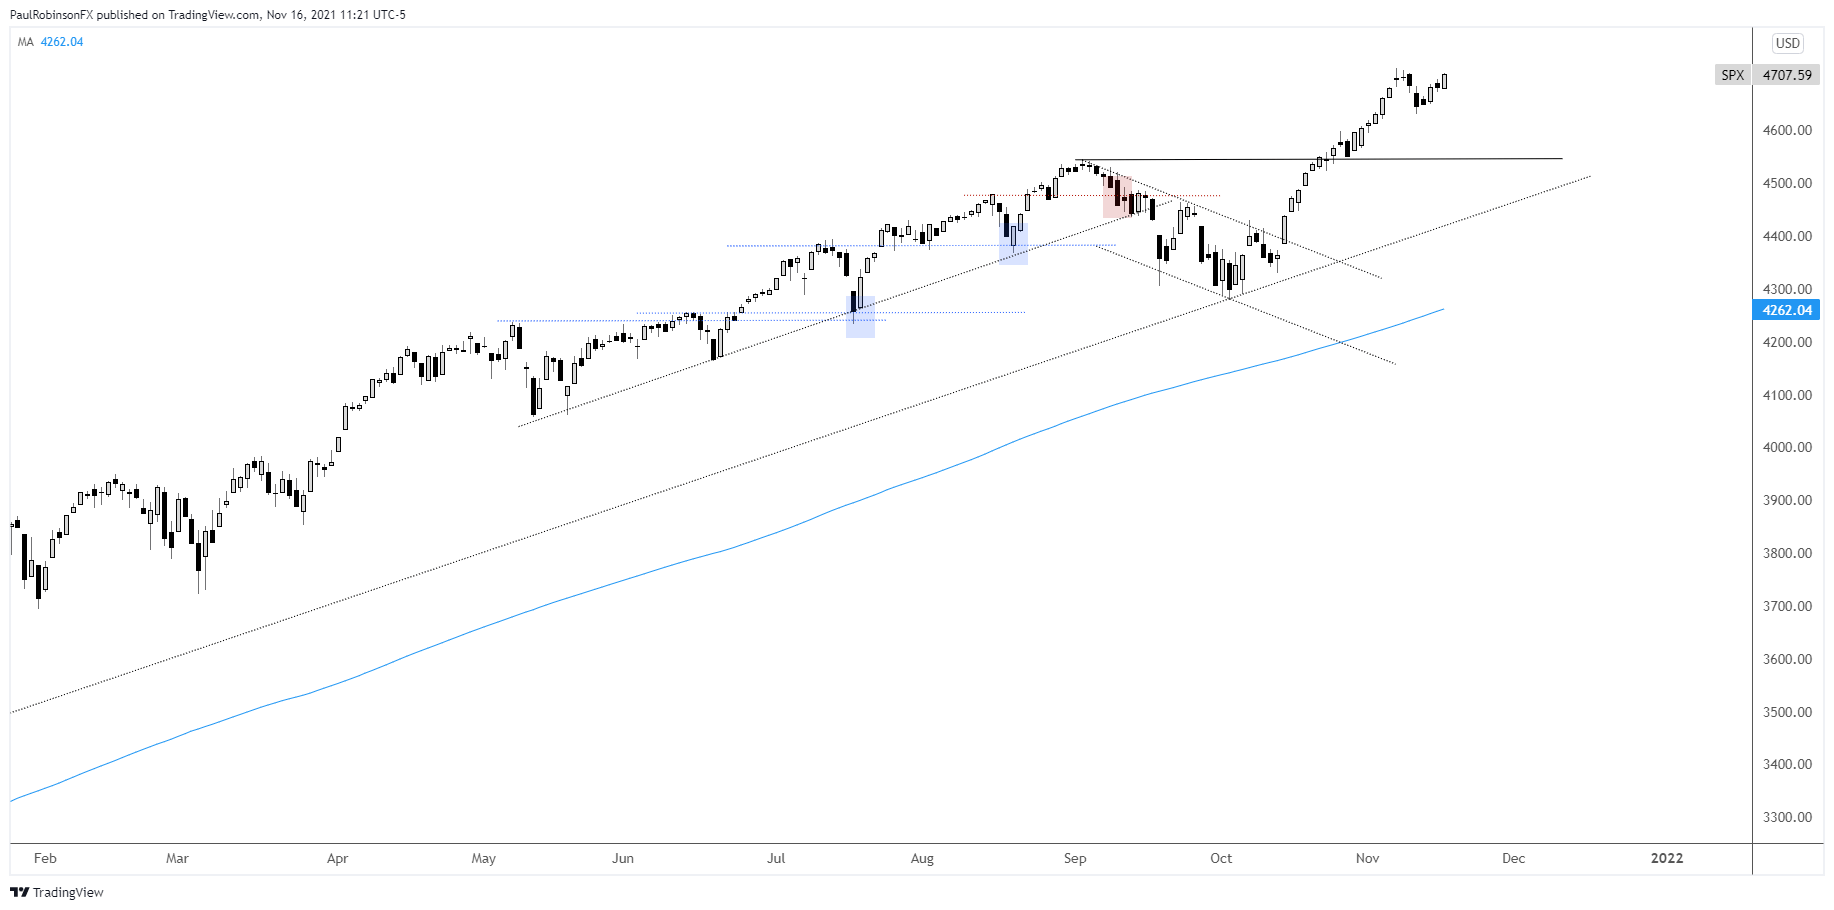
In today’s video, I discussed a number of charts of major macro markets and their outlook. I started with the biggest risk barometer, the S&P 500. Stocks could use a period of consolidation to build a base for what would then likely be a more sustainable leg higher versus if it just keeps floating higher. A pullback to the prior high could unfold, which could be a nice test of trend support at 4545. Overall, the outlook remains neutral to bullish. European indices remain quite strong while the Nikkei is a laggard that may want to be avoided for now from the long-side, and could even be a go-to target for would-be shorts should global markets start to weaken.
S&P 500 Daily Chart
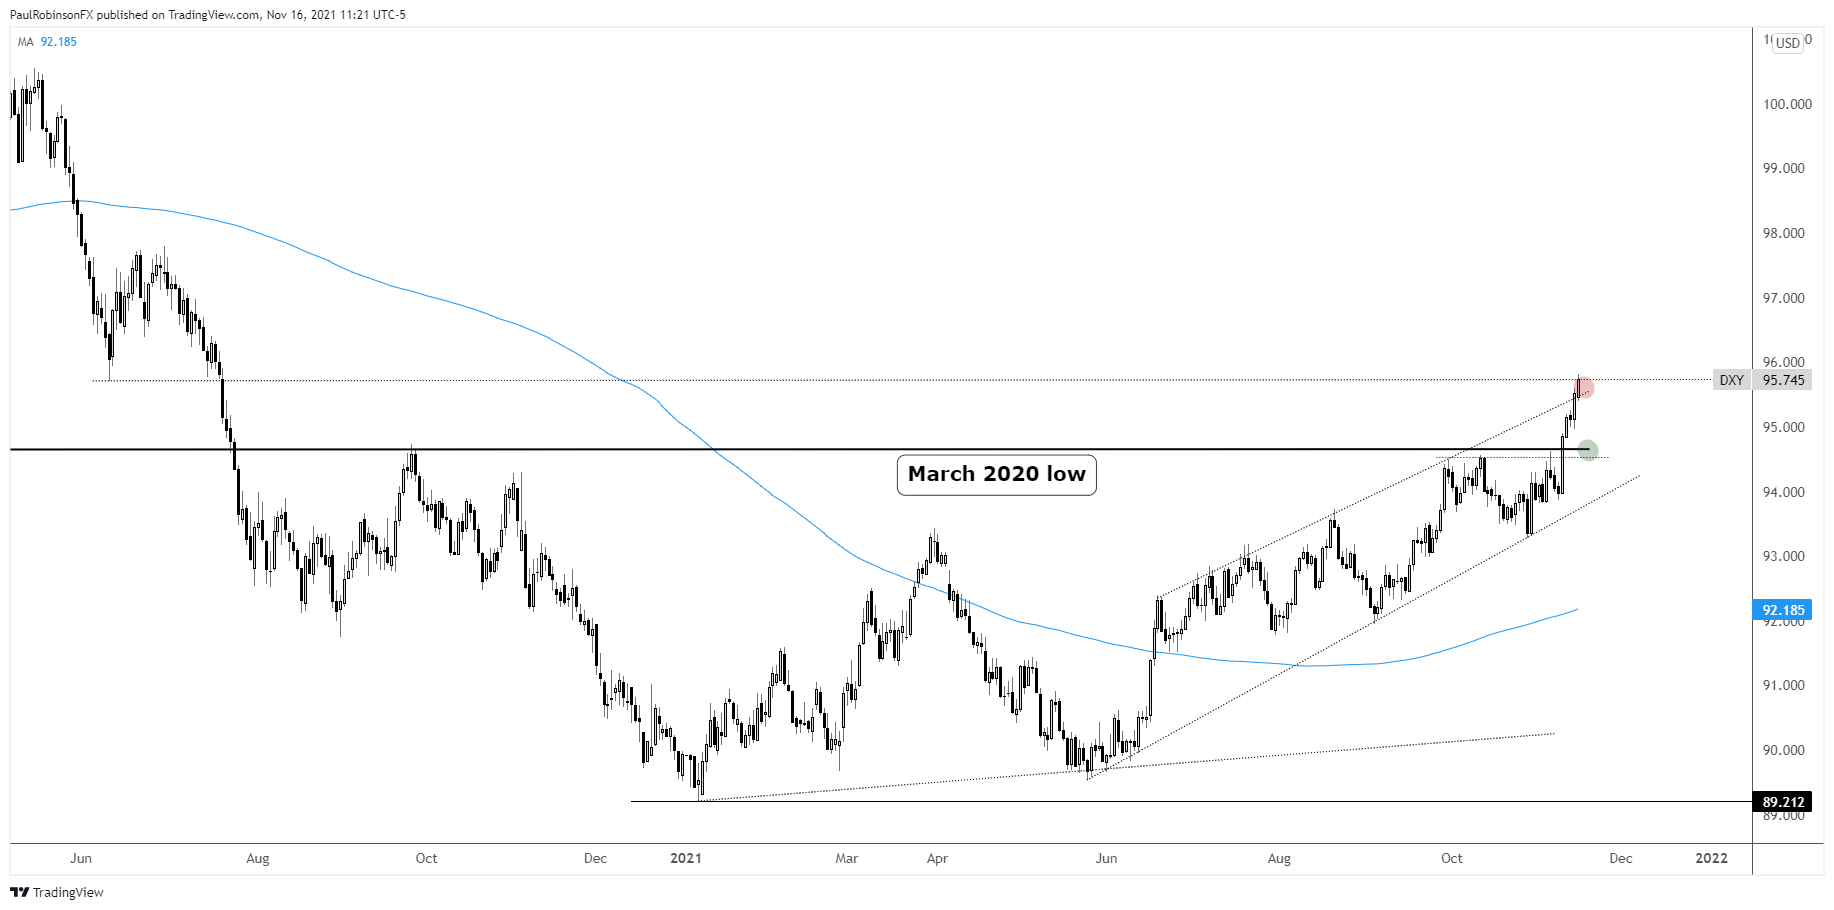
Moving on to the dollar, the DXY is making good on a recent breakout and now in a test with a minor level of resistance from last summer. It could use a little pullback or consolidation here before trading higher, but the bias remains constructive.
US Dollar Index (DXY) Daily Chart
Gold is in open space right now, with 1916 up as the next level of significant resistance. Silver is caught between a rock and a hard place as it trades between the neckline of a confirmed inverse head-and-shoulders pattern and the 200-day moving average. The long-term MA will need to break for the bullish pattern to keep up its end.

Silver Daily Chart

Oil is neither here nor there and may be undergoing a constructive period of consolidation that later leads to higher levels. Overall, the outlook is neutral at the moment but still bullish long-term. Copper is also neither here nor there at the moment with the 200-day moving average acting as support for now. The 10-year isn’t doing anything particularly appealing, so stepping aside on this one.
Cryptos are breaking down but that may only be temporary. Watch for signs that it is a transient move. A forceful reversal of today’s drop would be such a sign that the short-term correction is over and higher levels await.
For the full details, please check out the video above…
Resources for Forex Traders
Whether you are a new or experienced trader, we have several resources available to help you; indicator for tracking trader sentiment, quarterly trading forecasts, analytical and educational webinars held daily, trading guides to help you improve trading performance, and one specifically for those who are new to forex.
---Written by Paul Robinson, Market Analyst
You can follow Paul on Twitter at @PaulRobinsonFX


