


Japanese Yen, EUR/JPY, CAD/JPY - Talking Points
- EUR/JPY has retreated from threatening to make a new high
- CAD/JPY momentum signals are mixed between durations
- Is Japanese Yen caught at the crossroads against EUR and CAD?

EUR/JPY – Technical Analysis
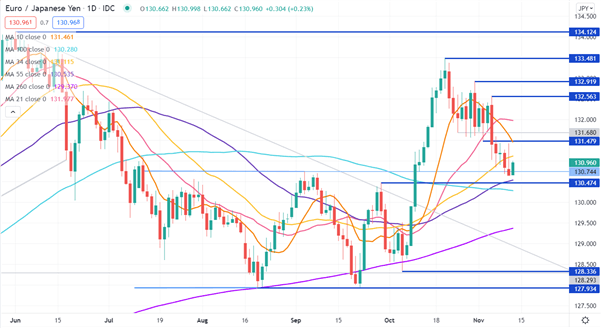
There appear to mixed signals for EUR/JPY for now. It failed on a run up to take out the June high of 134.124 and pulled back below the break-out pivot point of 130.744.
A Double Bottom was made through September and October at 127.934 and we are near the middle of the broad trading range of 127.934 and 134.124.
Conflicting messages are coming from the simple moving averages (SMA) that have varying gradients across different time horizons. The 34, 55 and 260-day SMAs have a positive gradient while the 10, 21 and 100-day SMAs have a negative slope.
Resistance could be offered at a pivot point at 131.479 or the previous highs of 132.563, 132.919, 133.481 and 134.124.
On the downside, support might be provided at the pivot point of 130.474 or at prior lows of 128.336 and 127.934.
Introduction to Technical Analysis
Moving Averages
Recommended by Daniel McCarthy
CAD/JPY – Technical Analysis
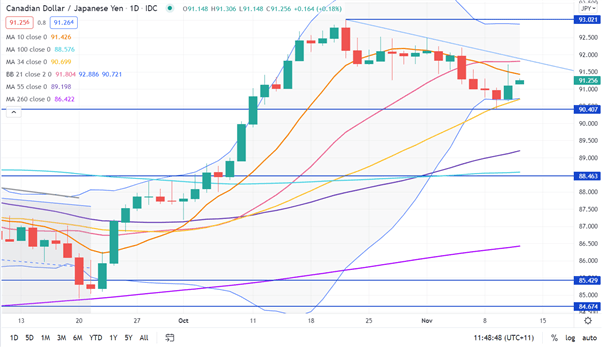
CAD/JPY made a 6-year high last month at 93.021 and this might be a resistance level. Since making that peak, CAD/JPY has drifted lower, moving below the 10-day simple moving average (SMA).
Looking at the 10, 21, 34, 55 100 and 260-day SMAs, it is short-term momentum that appears to have stalled, with the price and the 10-day SMA currently under the 21-day SMA. The medium and long-term SMAs, represented by the 34, 55, 100 and 260-day SMAs, are all below the price and the short-term SMAs. This could suggest that underlying medium and long-term momentum might be bullish.
Should the price and 10-day SMA go above the 21-day SMA in the near term, potential bullish momentum may evolve further.
The recent move lower traded outside the lower band of the 21-day SMA based Bollinger Band but did not have a close outside the band.
That low of 90.424 was just below the 34-day SMA and just above the pivot point of 90.407. Support could be provided at 90.407 - 90.424 and at another pivot point at 88.463.
The width of the bands also narrowed of late, which represents a lower volatility reading for the cross. This might suggest a consolidation phase for CAD/JPY.
--- Written by Daniel McCarthy, Strategist for DailyFX.com
To contact Daniel, use the comments section below or @DanMcCathyFX on Twitter


